In linear regression taking log is popular way to make relationship linear. We can take log of either response or predictor or both. This gives us four classes [0]
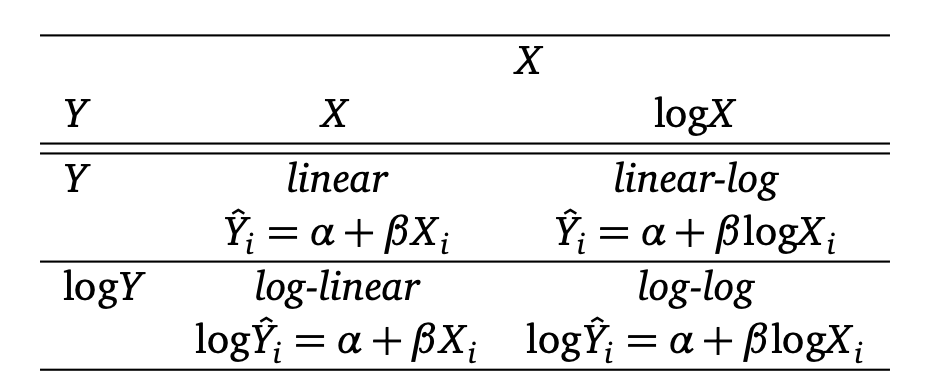
Interpretations of β
- Linear Model
- the coefficient β gives us directly the change in Y for a one-unit change in X
- Linear Log Model
- β is the expected change in Y when X is multiplied by e (natural log)
- Log Linear Model
- Each 1-unit increase in X multiplies the expected value of Y by e β
- Log Log Model
- multiplying X by e will multiply expected value of Y by e βˆ
I have coded notebook to see the curves for all four at [1].
A note on Normalisation
- Suppose you need to normalise a data to bring it between 0 and 1. This will be feed into some linear function (say ranking function without supervised response y). If you data is exponentially distributed instead of dividing by max, you can try log(sample)/log(max). This is like feature transformation by taking log and then normalising it.
- That’s about normalising variable which seems to have exponential distribution
- Also when you check correlation with response variable and you see plots like [1] you know which transformation to take.
References :

[0] https://kenbenoit.net/assets/courses/ME104/logmodels2.pdf
[1] https://github.com/arcarchit/datastories/blob/master/notebooks/log_linear_models.ipynb