The chi–square independence test is a procedure for testing if two categorical variables are related in some population.
Here is handwritten example : https://github.com/arcarchit/datastories/blob/master/notes/chi2.pdf
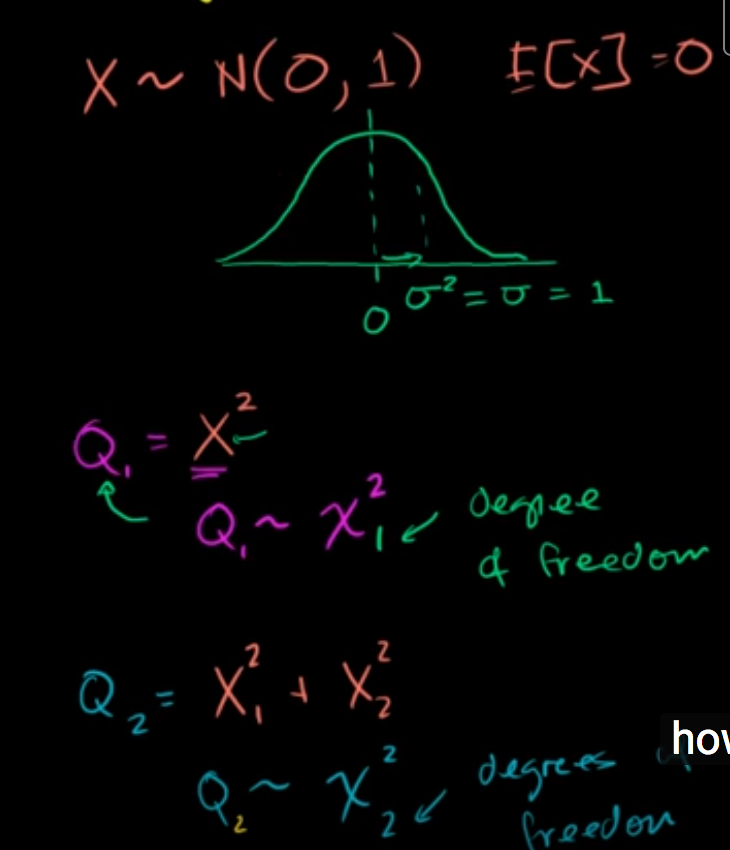
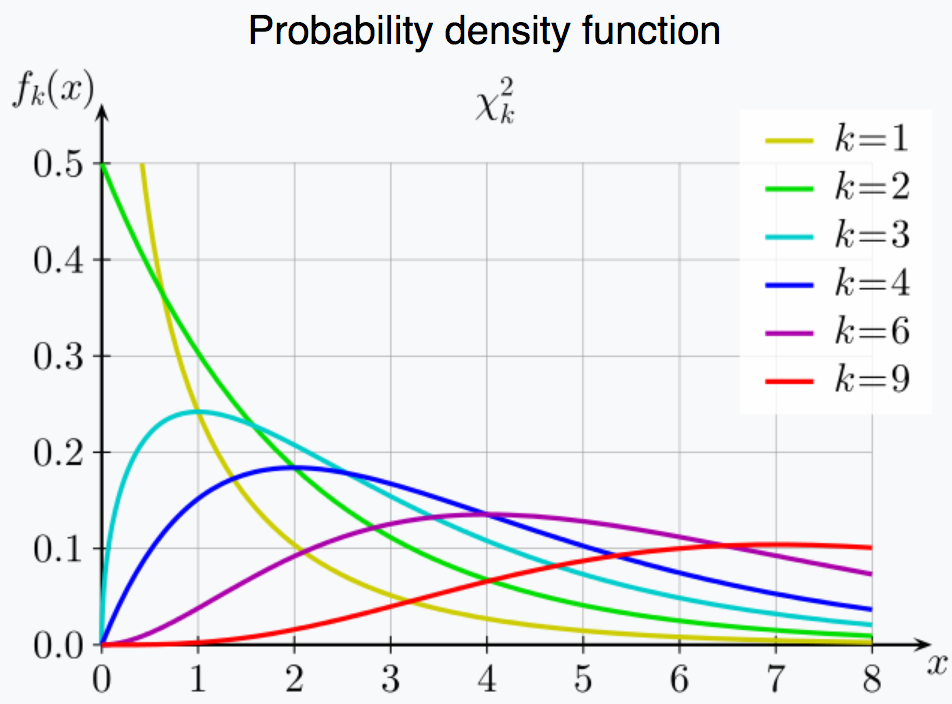
Chi square distribution
- Chi square distribution
- Squaring samples from standard normal distribution [0]
- Distribution changes with degrees of freedom
- When DoF = 1 it is more concentrated around 0
- It is distribution is sum of squares
- When dice is biased sum of squares will be higher. Hence more significant.
- When it is fair it will be closed to zero. Difference is with expected value.
Chi Square Test for Equality of Proportions
- H0 : Distribution of some variable is same in all population
- Example of testing coin fairness
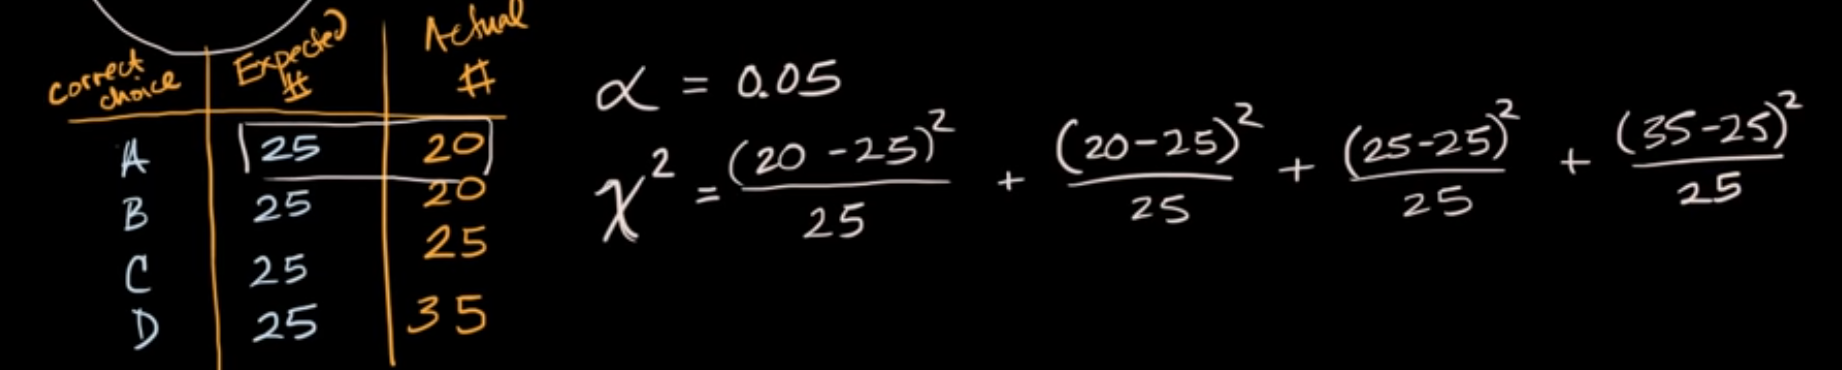
- Multiple choice questions (A, B, C, D)
- H0 = Equal probability of correct choices (P(A) = P(B) = P(C) = P(D) = 0.25)
- Degrees of Freedom is 3 here
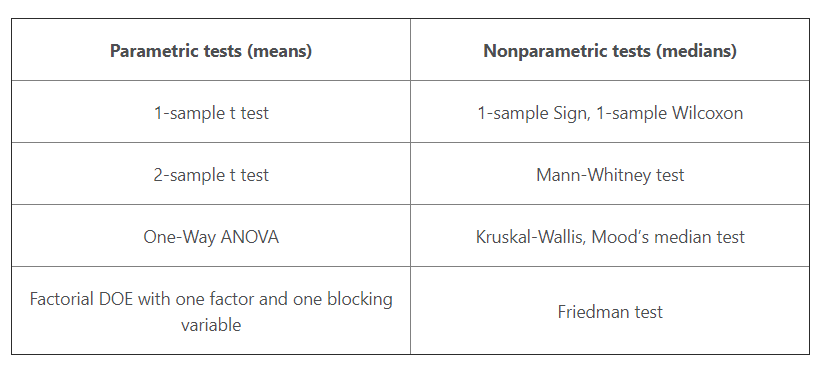
Chi square vs T test
- When to use which one
- T-test is used to compare mean of two distributions
- Chi square is used to check whether observation gathered of categorical data meets the assumption
Chi Square for goodness of fit testing
- Chi Square Goodness of fit
- Restaurant example
- H0 = Percentage given by customer is correct
- We calculate expected for each cell and calculate chi^2
Chi Square for relationship testing
- H0 : Variables are independent of each other
- It helps testing if two categorical variables are related
- Calculate Chi square statistics by summing all cells and check against degree’s of freedom
- Examples
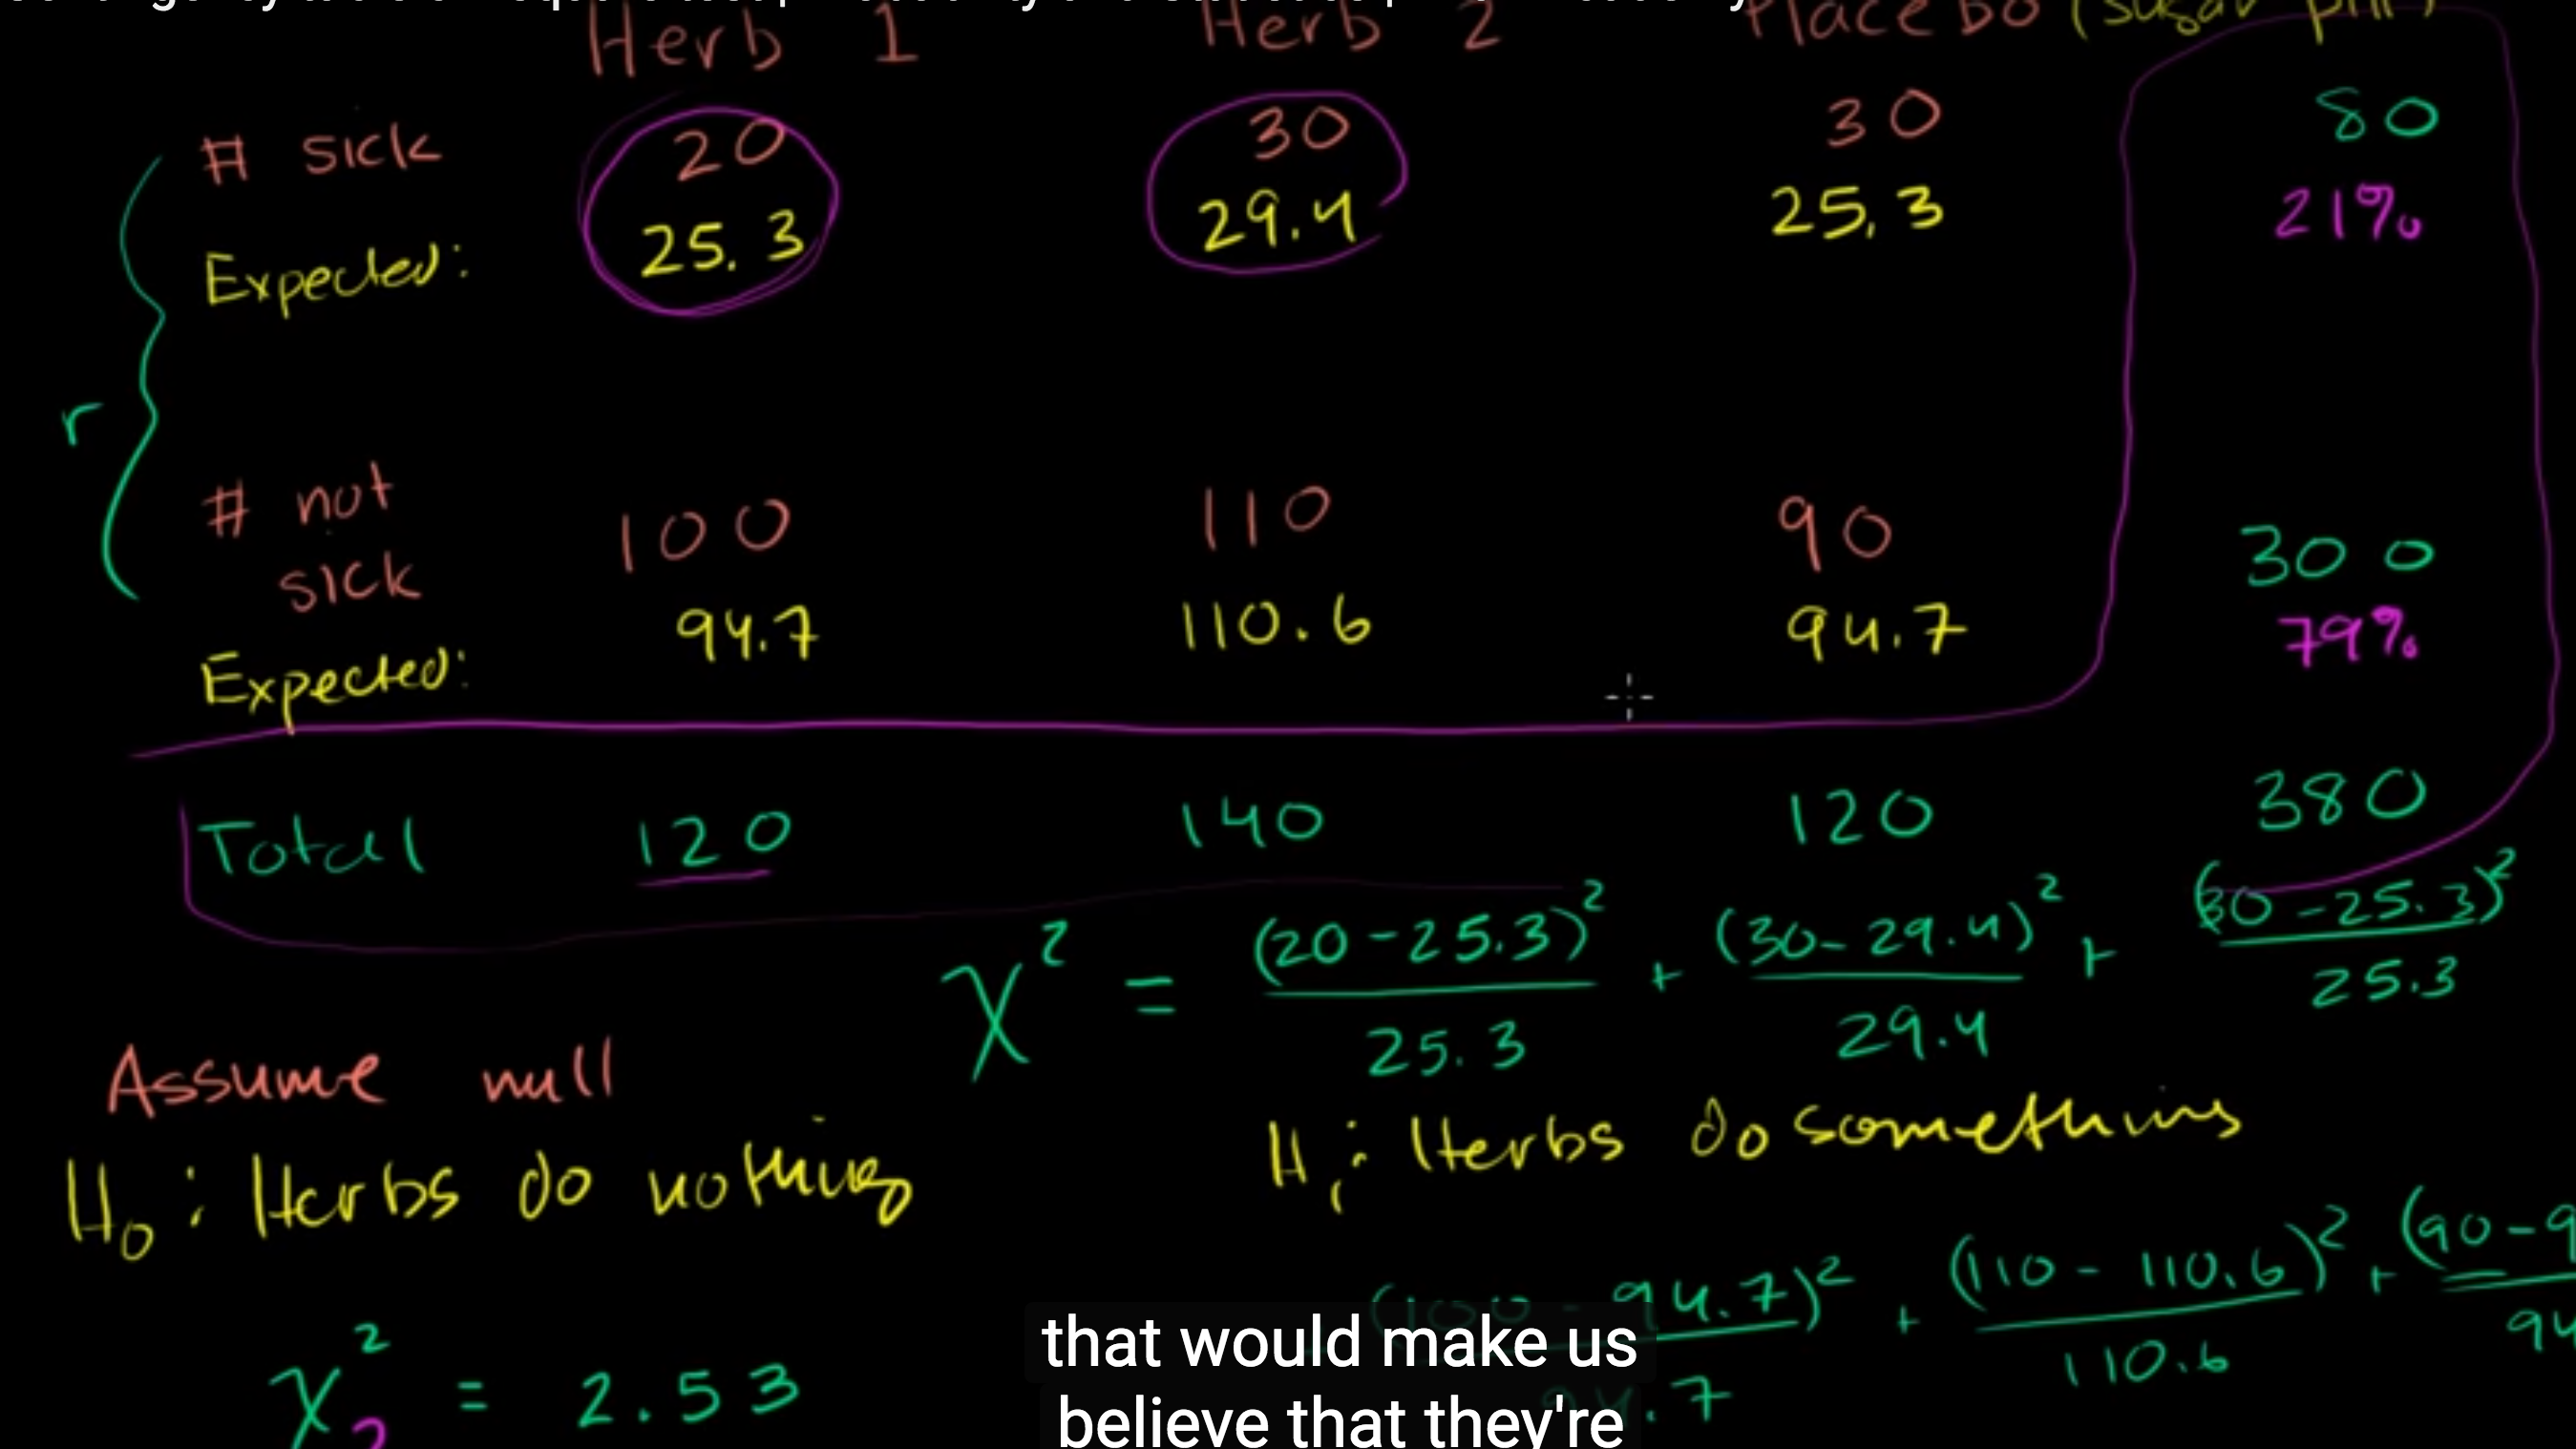
- Hypothesis testing :
- H0 = Herbs1, Herb2, placebo are same
- H0 = Herbs do nothing
- We can’t say herb does nothing
- We are working on accumulated data here
- Whereas ANOVA is about variance
- Homogeneity testing :
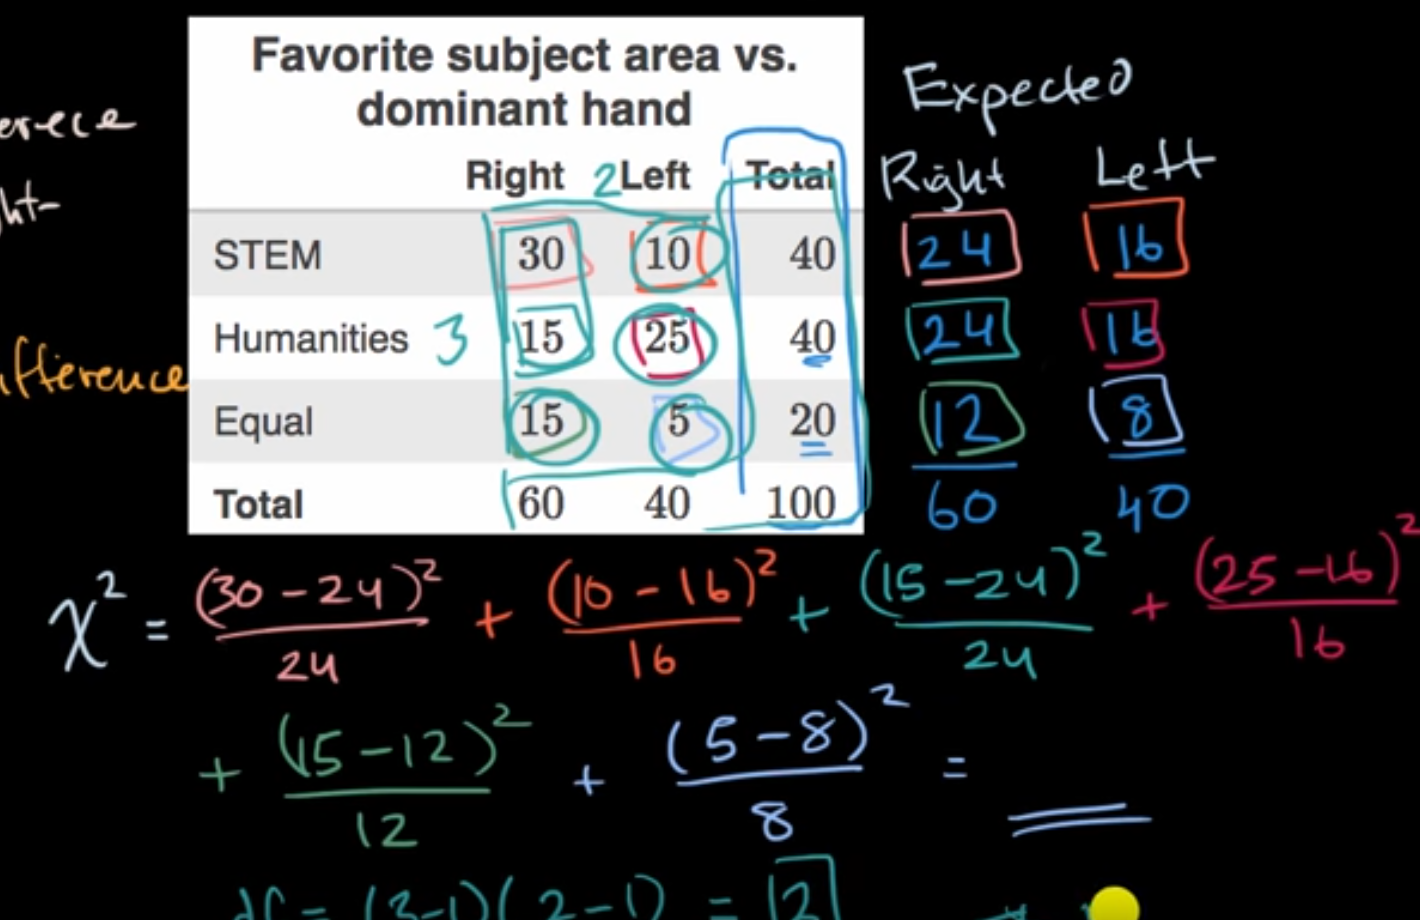
- H0 = Left and Right handed people have same preference for arts, science
- H0 = Preference of arts/science is independent of natural hand left/right
- H0 = Variables are independent
- Filling up table
- P(STEM | right) = P(STEM)
- x / 60 = 40/100 => x = 40 * 60 / 100 = 24
- We can also say that value of cell is product of marginals divide by total
- Degrees of freedom = (r-1)*(c-1) = 2 * 1 = 2
- Hypothesis testing :
References
[2] : https://biology.stackexchange.com/questions/13486/deciding-between-chi-square-and-t-test
[3] : https://fhssrsc.byu.edu/SitePages/ANOVA,%20t-tests,%20Regression,%20and%20Chi%20Square.aspx