
We calculate the t-score using hypothesis data, which also provides us with the degrees of freedom. This value is then supplied to a function that gives us the probability of the hypothesis being true.
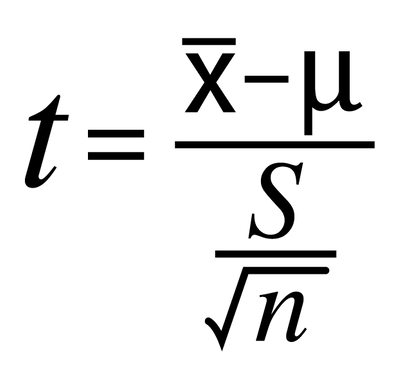
The t-test can be seen as a ratio, similar to a signal-to-noise ratio. The numerator allows us to center it around zero, while the denominator represents the standard error of the mean (SEM) calculated as s/sqrt(n), where s is the standard deviation of the samples.
The t-score indicates how many SEM the current mean is away from the mean given in the hypothesis. If it is far away, it suggests a low probability of the null-hypothesis-mean being true, leading us to reject the null hypothesis.
In engineering, we typically assume that the mean and standard deviation are given and true, and we compute the probability of observing the sample. However, in hypothesis testing with a small number of samples, we are testing whether the given mean is true or not.
To address this, we need a distribution that adjusts itself based on the number of observations, widening when there are fewer samples. The t-distribution serves this purpose, as it is dependent on the sample size.
There are different types of t-tests:
- One-sample t-test: Compares the mean of a sample with a known population mean.
- Discussion so far is for one sample test
- Two-sample t-test: Compares the means of two independent groups.
- To compare means of two independent groups
- Scores of student who get 8 hour sleep vs four hour sleep
- Question we want to answer is are there any significant difference in there scores?
- In one sample test (In numerator of t-score) we are comparing sample mean with population mean
- In two sample test it compares means of two independently drawn sample
- And in denominator as well SEM formula is modified
- Example
- A/B testing on e-commerce site where you compare CTR before and after
- This is two sample because you don’t have standard value of CTR before the feature
- Even you will see some difference in AA test
- A/B testing on e-commerce site where you compare CTR before and after
- Paired t-test: Compares the means of two conditions using the same samples.
- This is essentially a one-sample t-test on the differences between values at two conditions.
- Same samples are used in two different conditions
- 10 people before medication and same 10 people after medication
- We want to check if medication has any effect
- Different time points are used for market calculation
- This essentially is a one sample T-test on the differences of value at two different conditions
- Example
- Interleaving test in e-commence search system
- For each search page you will assign some score to control and variant
- One-sided t-test: Tests a hypothesis in one direction (e.g., weight of dairy milk is less than 100g).
- Two-sided t-test: Tests a hypothesis in both directions (e.g., weight of dairy milk is not equal to 100g).
P-values represent the probability of finding the observed or more extreme results when the null hypothesis is true. It is described in terms of rejecting the null hypothesis when it is actually true, but it is not a direct probability of this state.
For further examples and details, you can refer to the following link: Example Link

