
In this post, we will explore the values in the summary(model) output in R and understand their significance.
Here is a screenshot illustrating the summary:
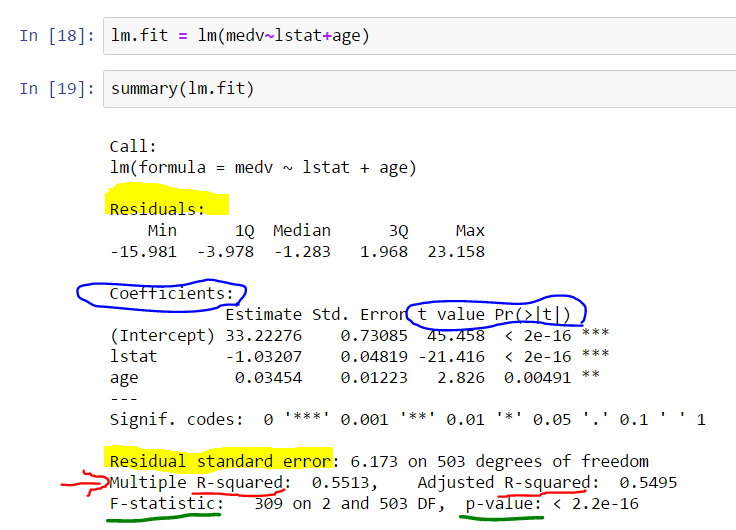
Significance of Residue
- We desire our residues to be normally distributed and centered around zero.
- It’s similar to aiming at the bullseye on a dartboard.
- If the residues are biased in one direction, there is room for improvement.
- If the residues are equally biased in all directions, we can attempt to reduce the standard deviation.
- Irreducible error should be observed in all directions simultaneously.
- Residues quantile provides an initial insight into symmetry.
- R also provides the standard deviation of residuals, known as RSE (residue standard error).
The Relationship between t-value and p-value in the Coefficient Section
- The values test if a variable has a relationship with the output.
- This is a preset statistical question (null hypothesis) that cannot be changed.
- If the coefficient is zero, it does not contribute; otherwise, it does.
- The t-value indicates the number of standard deviations the mean is away from zero.
- A larger t-value signifies a more significant variable.
Calculating p-values
- Incorrect thinking: Taking samples from a larger population.
- Each sample yields a different coefficient, which can be zero for some samples.
- The variance of the estimated parameter can be mathematically derived using (X^T * X)-1 with σ2.
- σ2 can be obtained from the residue error.
- Bayesian view helps appreciate the distribution of coefficients rather than point estimation.
- P-values can be calculated naturally using the T-distribution, as there are no assumptions.
- In the R result display, we have a mean and standard deviation.
- The coefficient is a probabilistic variable centered at the mean (Estimate in R summary).
- The mean is t standard deviations away from zero.
- The p-value represents the probability of observing a coefficient beyond t standard deviations from the mean.
Role of R^2
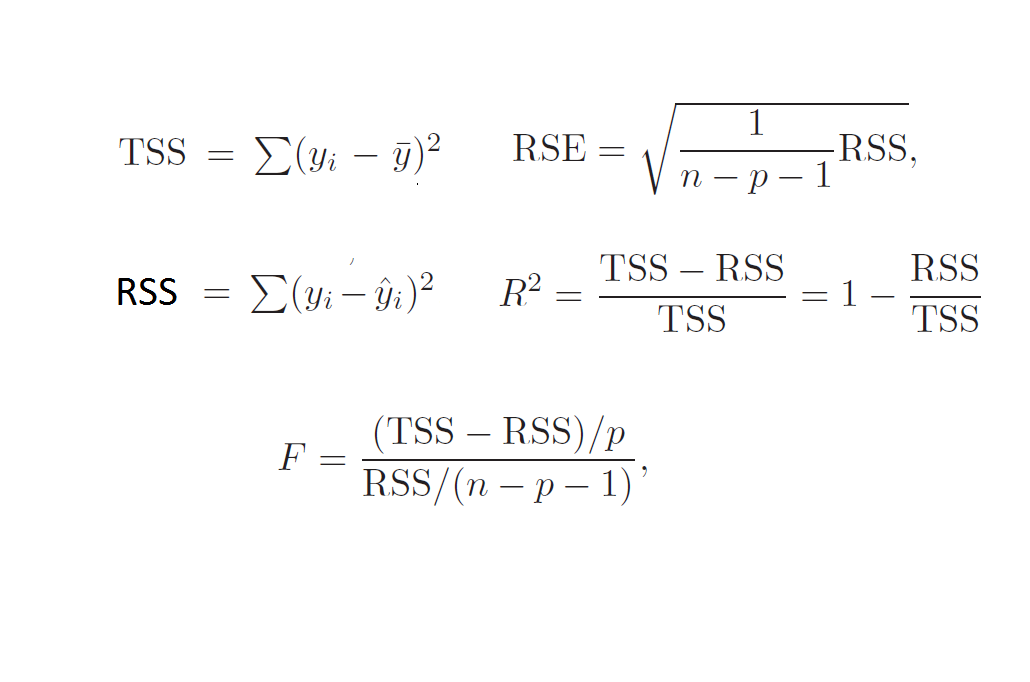
- R^2 indicates how much of the variance is explained by the model. Refer to formulas above for a better understanding.
- R^2 has an advantage over RSE as it always falls between 0 and 1.
Determining a Good Value of R^2
- A good value of R^2 depends on the problem setting.
- When we make perfect predictions, RSS = 0 and hence R^2 = 1
- In physics, if we are confident the data follows a linear model, R^2 close to 1 is desirable.
- In marketing, a small proportion of the variance can be explained by predictors, so R^2 = 0.1 can be realistic.
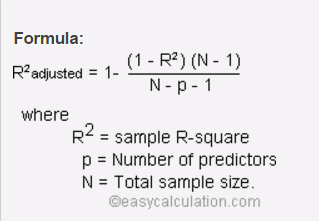
Difference between Absolute and Adjusted R^2
- R^2 always increases with the number of variables, while adjusted R^2 decreases if the added variable is not significant.
- The formula of adjusted R^2 incorporates the number of variables, so when a non-significant variable is added, the result decreases.
- The formulas below illustrate that RSE may increase while RSS decreases, but they are not directly related to R^2.
Significance of F Statistics
- The F-test determines if a group of variables is jointly significant, whereas the t-test examines the significance of individual variables.
- F-statistics also have associated p-values.
- The null hypothesis for the F-test is that the intercept-only model and your model are equal.
- While R-squared provides an estimate of the relationship strength between the model and response variable, it does not offer a formal hypothesis test. This test is provided by the F-test.
Why Use F Statistics when Individual Coefficient p-values are Available?
- It may seem that if one coefficient is significant (good p-value), the overall model will also be significant.
- However, this assumption breaks down when the number of variables with poor p-values is large.
Determining Good Values of F-statistics
- It depends on the values of n (number of observations in the training set) and p (number of independent variables).
- When n is large, an F-value slightly greater than 1 is sufficient to reject the null hypothesis.
- It is advisable to base decisions on corresponding p-values, which consider both n and p.
Degrees of Freedom:
- Suppose you have two features, x1 and x2, and a target variable y.
- The line equation is y = a1x1 + a2x2 + a3.
- In a 3D space, three points define a unique line.
- With n points, p(2) features, and 1 target, three points will always lie on the line, while (n-p-1) points can deviate from it. This difference represents the degrees of freedom.
- Degrees of freedom are the difference between n and the number of non-zero coefficients, including the intercept.
Significance Score “***” in the Coefficient Section
- R indicates the significance of a p-value by displaying stars.
- The calculation of this value is likely done through bootstrapping.
- Bootstrapping allows assigning measures of accuracy to sample estimates, such as bias, variance, confidence intervals, or prediction error.
- In Bayesian inference, parameter distributions are obtained, allowing the calculation of p-values.
References
Found the formula for adjusted R2 here


One thought on “Interpreting Statistical Values”