
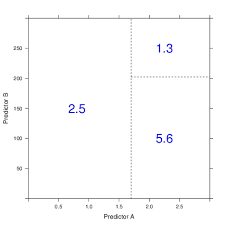
Figure below shows how decision tree creates rectangle in predictor space:
As we have describe classification tree, the only difference here is how to come up with output instead of label and how to define a metric other than entropy/gini.
For output it uses the mean of leaves.
For metric CART methodology uses simple SSE.
- SSE = ∑ (y_i – y1)² + ∑(y_i – y2)²
- where y1 and y2 are means of two newly crated groups.
- It is simple sum of squares, not standard deviation
- While deriving R2 in linear recession we were concerned with sum of squares
- Ward linkage criterion in hierarchical clustering also uses difference in sum of squares
- diff = SSE_before – SSE_after
- We choose a predictor which minimizes SSE the most.
- diff is highest
My hand-coded regression tree is available at : https://github.com/arcarchit/datastories/tree/master/regression_tree
Reference
Applied predictive modeling by Max Kuhn and Kjell Johnson


2 thoughts on “Regression Trees”