Generative and Discriminative Models

Introduction

In machine learning, there are two broad categories of models: generative models and discriminative models. In this blog post, we will discuss some popular examples of each and their capabilities.

Generative Models

  1. Naive Bayes Classifier
  2. Hidden Markov Models
  3. Latent Dirichlet Allocation
  4. Boltzmann Machine
  5. Gaussian Mixture Model ( Unsupervised clustering)

Generative Models Explanation

Generative models allow us to generate datasets for specific classes, labels, or clusters. They estimate the joint probability distribution P(X, y). An example of this is the Naive Bayes Classifier, where we have a probability associated with each (X, y) pair. For classification, we predict y based on the highest probability given x.

π‘Žπ‘Ÿπ‘”π‘šπ‘Žπ‘₯𝑦𝑃(π‘Œ=𝑦|𝑋=π‘₯)=
π‘Žπ‘Ÿπ‘”π‘šπ‘Žπ‘₯𝑦𝑃(π‘Œ=𝑦,𝑋=π‘₯)/𝑃(𝑋=π‘₯) = π‘Žπ‘Ÿπ‘”π‘šπ‘Žπ‘₯𝑦𝑃(π‘Œ=𝑦,𝑋=π‘₯)/𝑃(𝑋=π‘₯)

Generative models offer more than just prediction. They can be used to:

  • Impute missing data
  • Compress datasets
  • Generate unseen data

Discriminative Models

  1. Logistic Regression
  2. Support Vector Machines
  3. Decision Trees

Discriminative Models Explanation

Discriminative models focus on learning the boundaries that separate different classes directly. They do not model the entire joint probability distribution but instead estimate the conditional probability P(y|x). Examples of discriminative models include Logistic Regression, Support Vector Machines, and Decision Trees.
Contrast Analysis

  • At Hypothesis and T-Distribution we discussed about hypothesis testing. We had talked about one sample and two sample t test.
  • Contrast analysis is more general case of that.
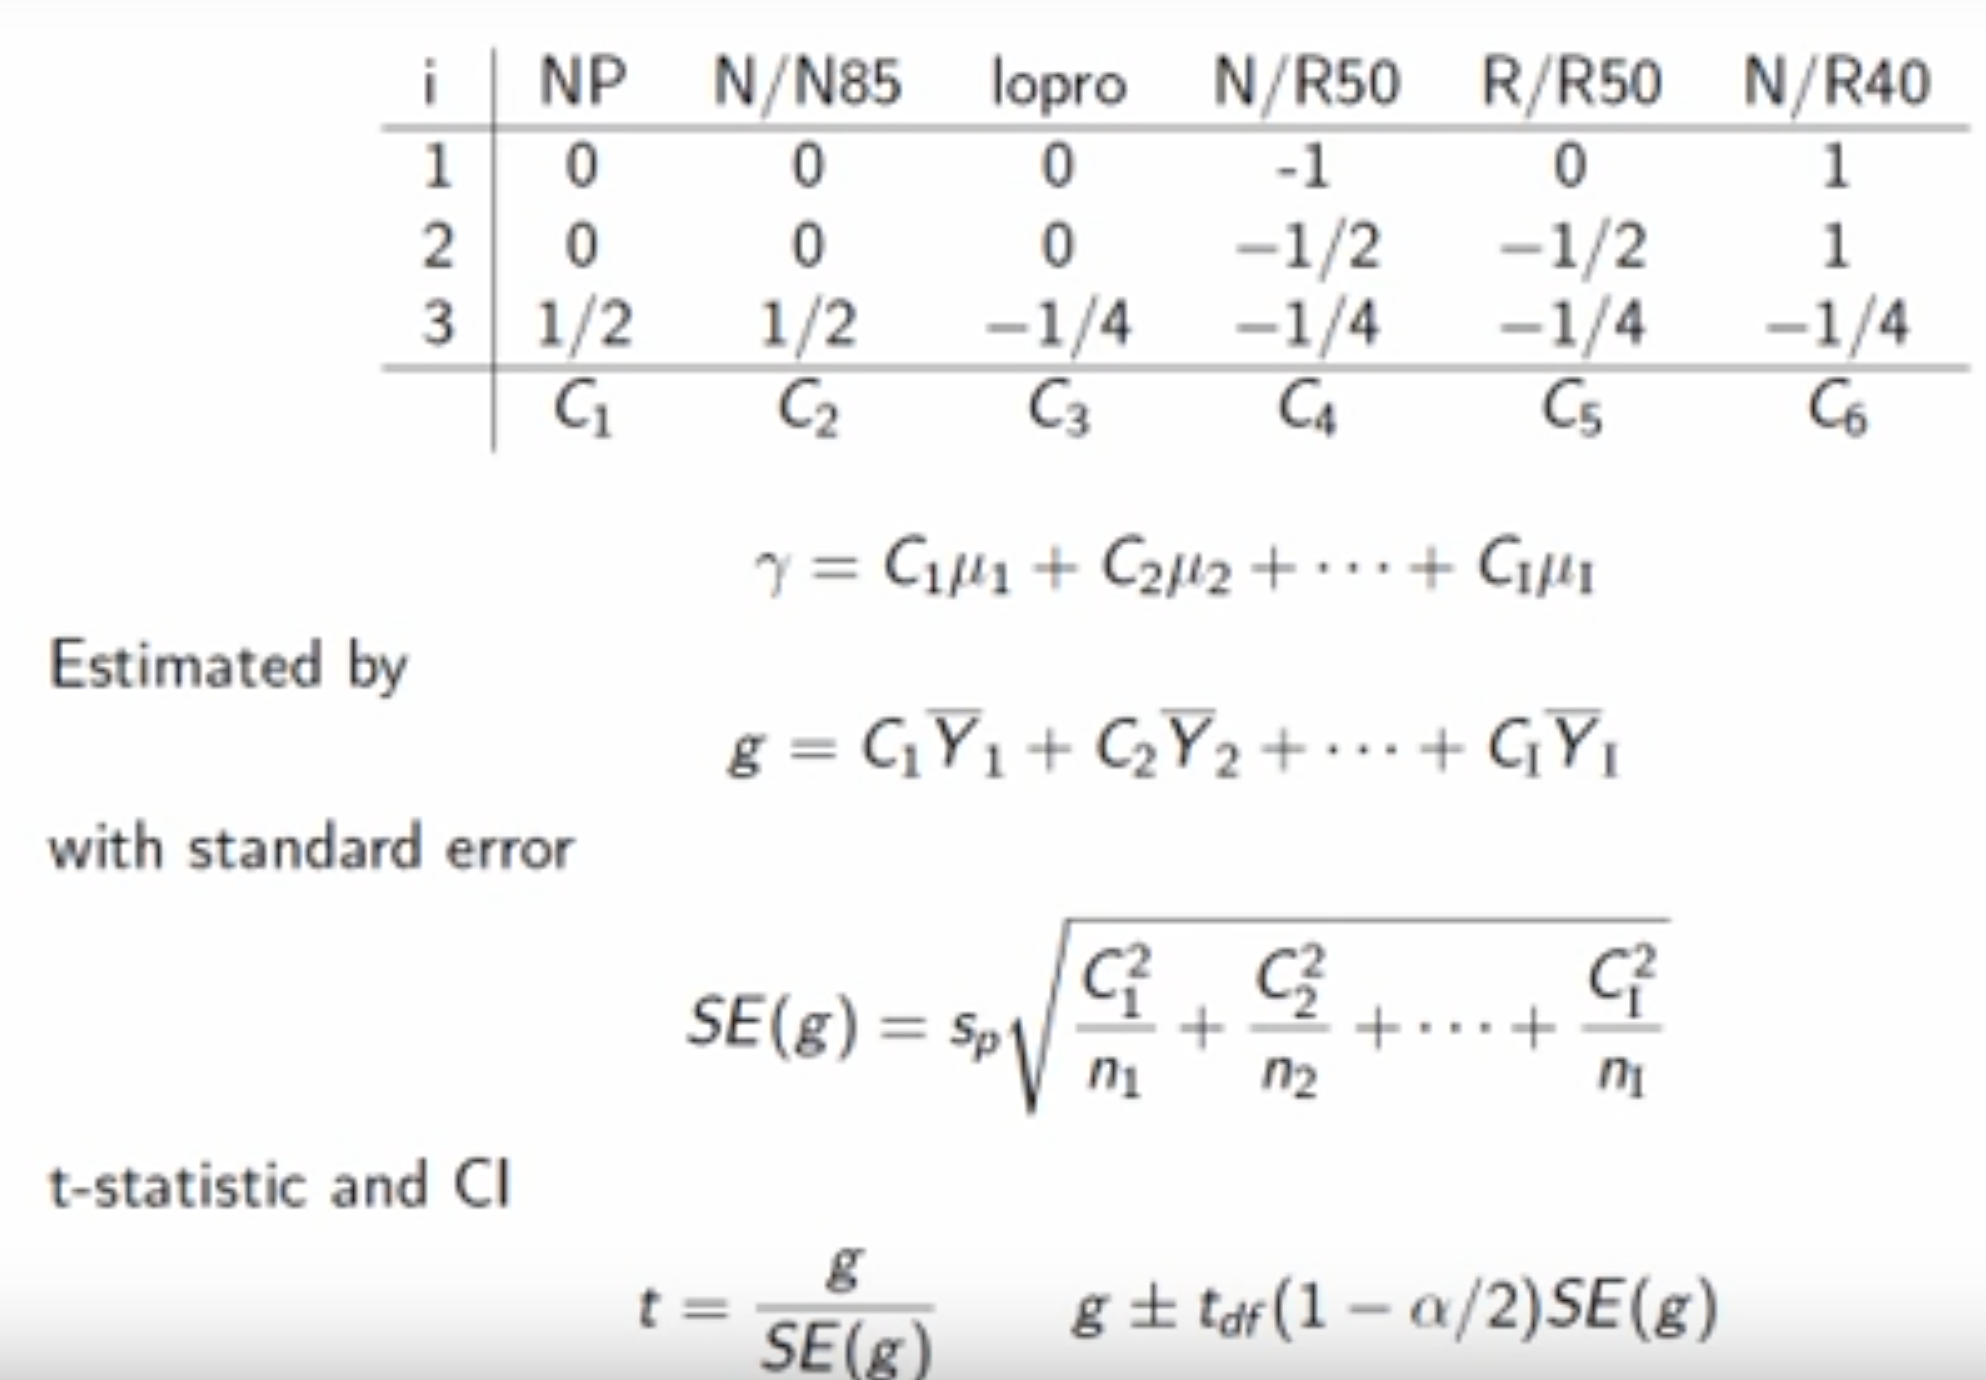
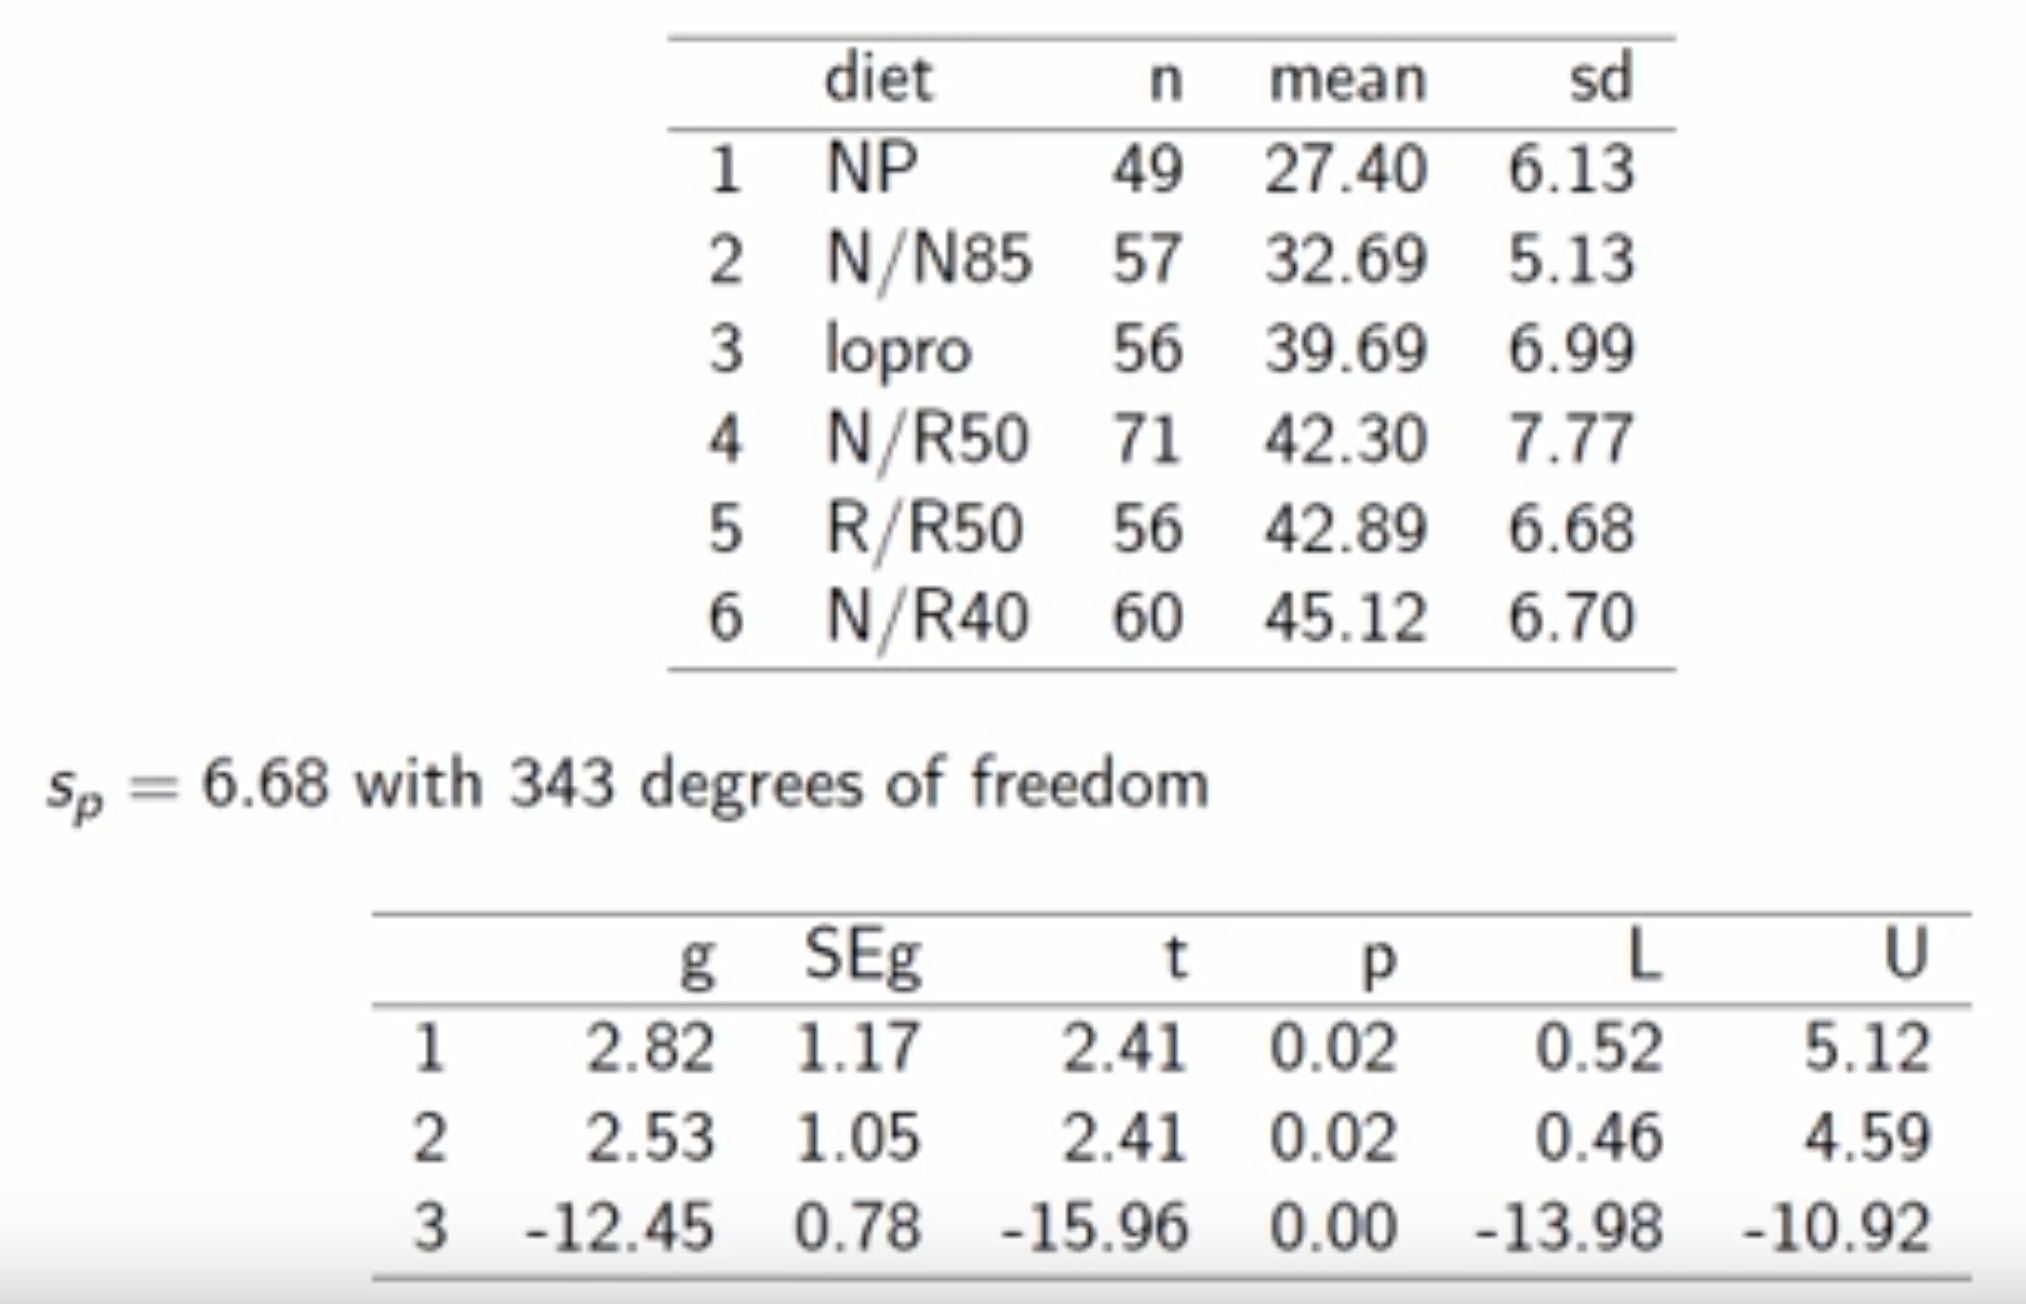
  • It allows us to make comparison of combination of groups :
  • Can’t we combine them to form just two groups :
    • We want to preserve individual identity of group
      • Group with large no of samples should not dominate group with small no of samples
  • Examples
    • Groups for which the context at test matches the context during learning (i.e., is the same or is simulated by imaging or photography) will perform better than groups with a different or placebo contexts. [2]
    • Group 1 is different from Group 2-3-4
      • 3 types of smile vs 1 neutral [3]
    • Group 1 and 4 are different from group 2,3


contrast1Β Β Β Β Β Β  contrast2

  • Intuition behind formula of standard error
    • Sum of square of combined group is some of individual SoS when groups are independent
  • Ξ± should be equal to desired confidence (0.90, 0.95 etc). It is divided by two because it is two sided


Reference

[1] : http://www.youtube.com/watch?v=yq_yTWK4mNs

[2] : https://pdfs.semanticscholar.org/c0ba/1c28b0e120a459820bfb20d430fa442ebd96.pdf

[3] : http://www.onlinestatbook.com/case_studies_rvls/smiles/index.html

NN : Batch Norm and Softmax Regression

This post is a lecture summary of Week 3 of the deep learning course by Andrew N. G, available at https://www.coursera.org/learn/deep-neural-network/home/welcome.

Hyperparameter Tuning

  • When the number of parameters is large, random search is better than grid search.
  • Grid search is more useful when the number of parameters is small, as it is more systematic.
  • Not all hyperparameters are equally important.
  • Choosing between babysitting one model (“Panda” strategy) or training multiple models in parallel (“Caviar”) depends on the computational resources available.

Batch Normalization

  • Normalizing input features speeds up learning by making the contours more circular.
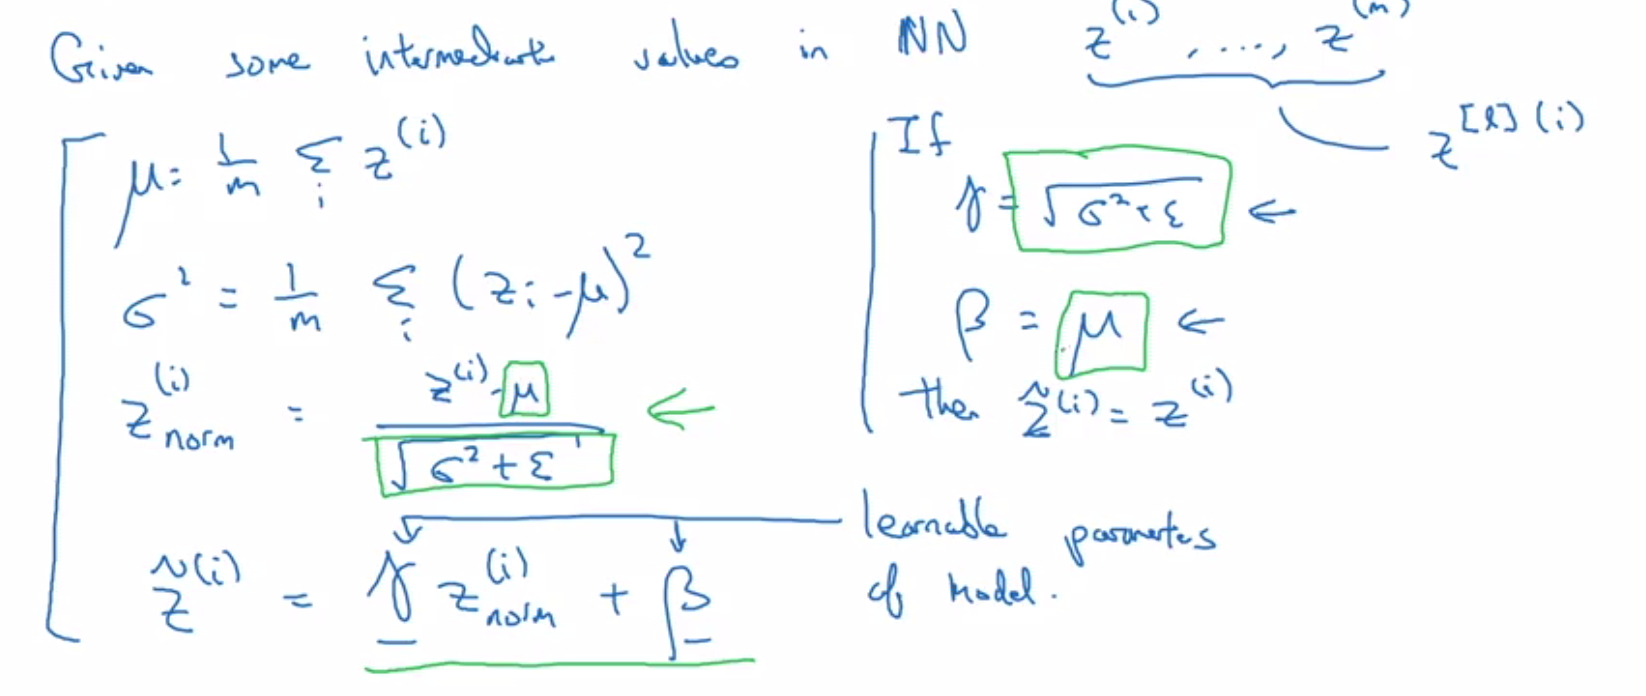
  • In practice, z[2] is normalized instead of a[2].
  • Ξ² and Ξ³ are introduced to allow for non-zero mean and non-unit variance.
    • Suppose you have sigmoid activation and you want larger variance to better exploit non-linearity
  • Different Ξ² and Ξ³ values are used for each layer.
  • In deep learning frameworks, batch normalization is often a single flag.
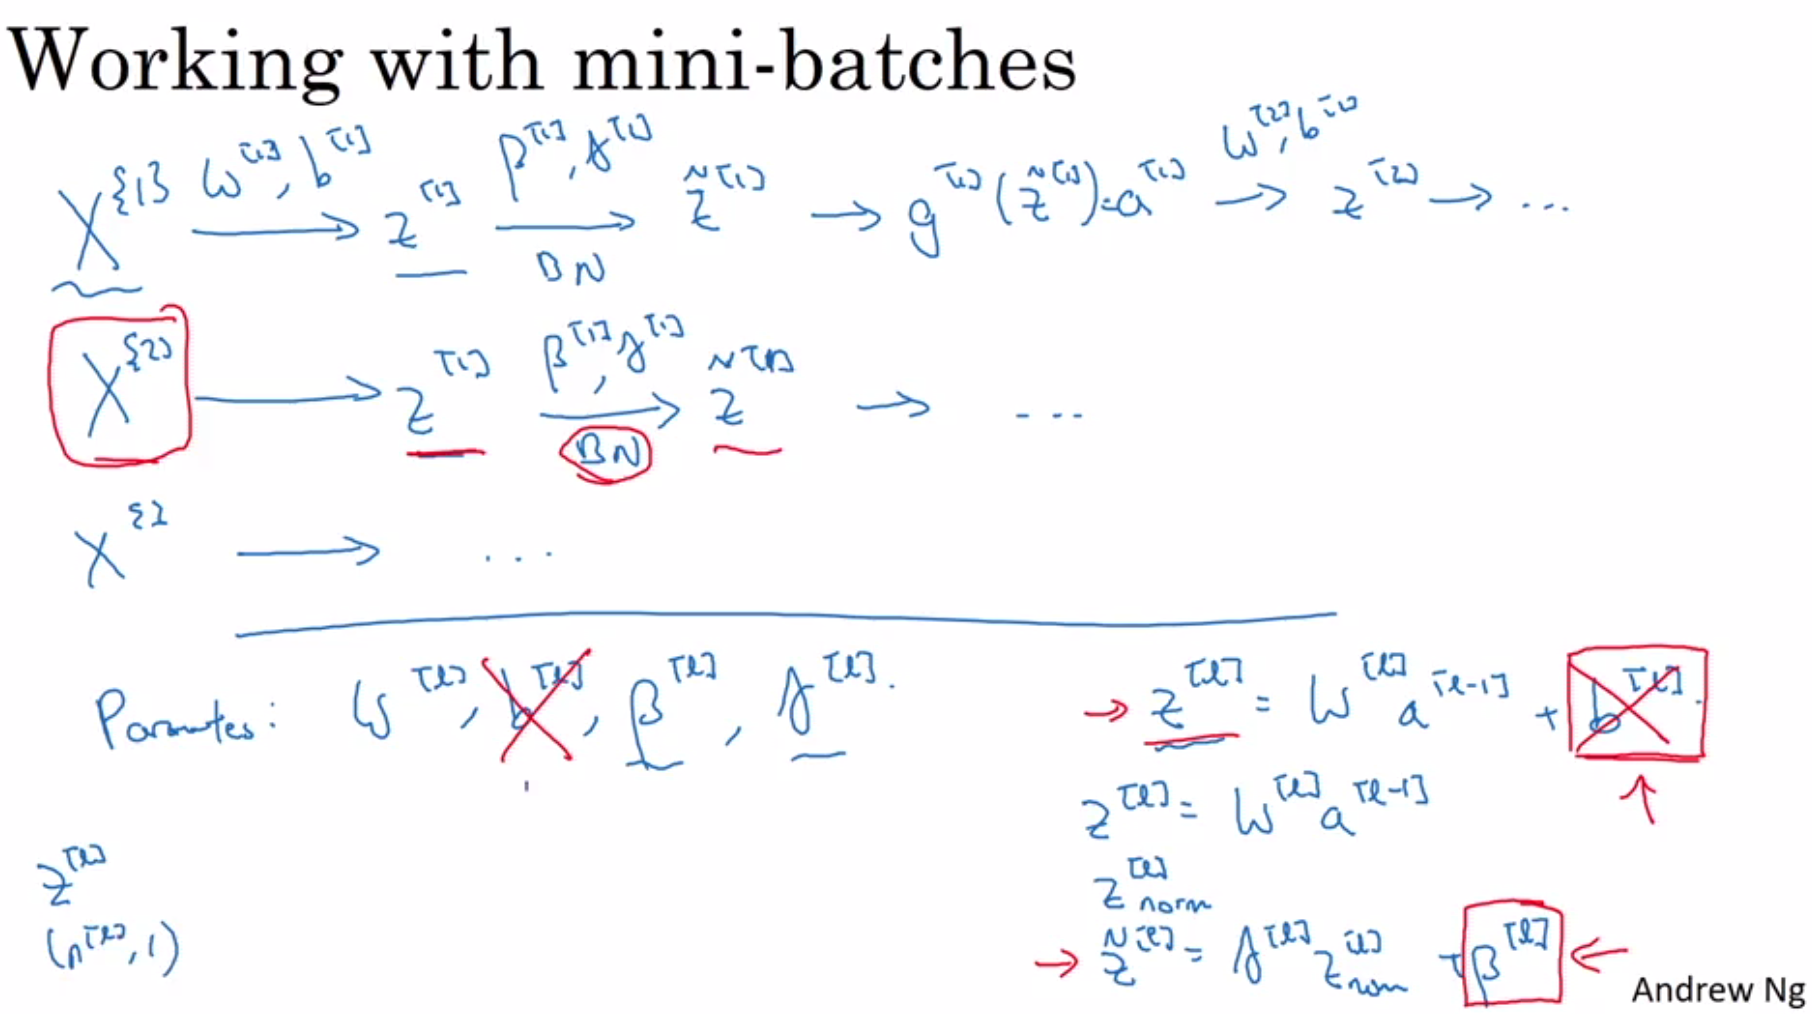
  • When using normalization, the bias term (b) has no effect and can be eliminated.

screen shot 2019-01-15 at 11.53.57 am

screen shot 2019-01-15 at 12.06.40 pm

  • Batch normalization speeds up training, limits distribution shifts of activation, provides more consistent data to later layers, and has a slight regularization effect.
  • Mean-variance scaling with different Ξ² and Ξ³ values for each mini-batch introduces noise similar to dropout, challenging later layers to not depend on a single feature.
  • Larger mini-batch sizes result in smaller regularization, but batch normalization is not primarily used for regularization.
  • During scoring, calculate Β΅ and Οƒ using exponentially weighted averages across mini-batches for each layer during training.
  • These averages are running averages and do not require much memory.
  • Use the above values for scoring.

Softmax Regression

  • Softmax regression is a generalization of logistic regression.
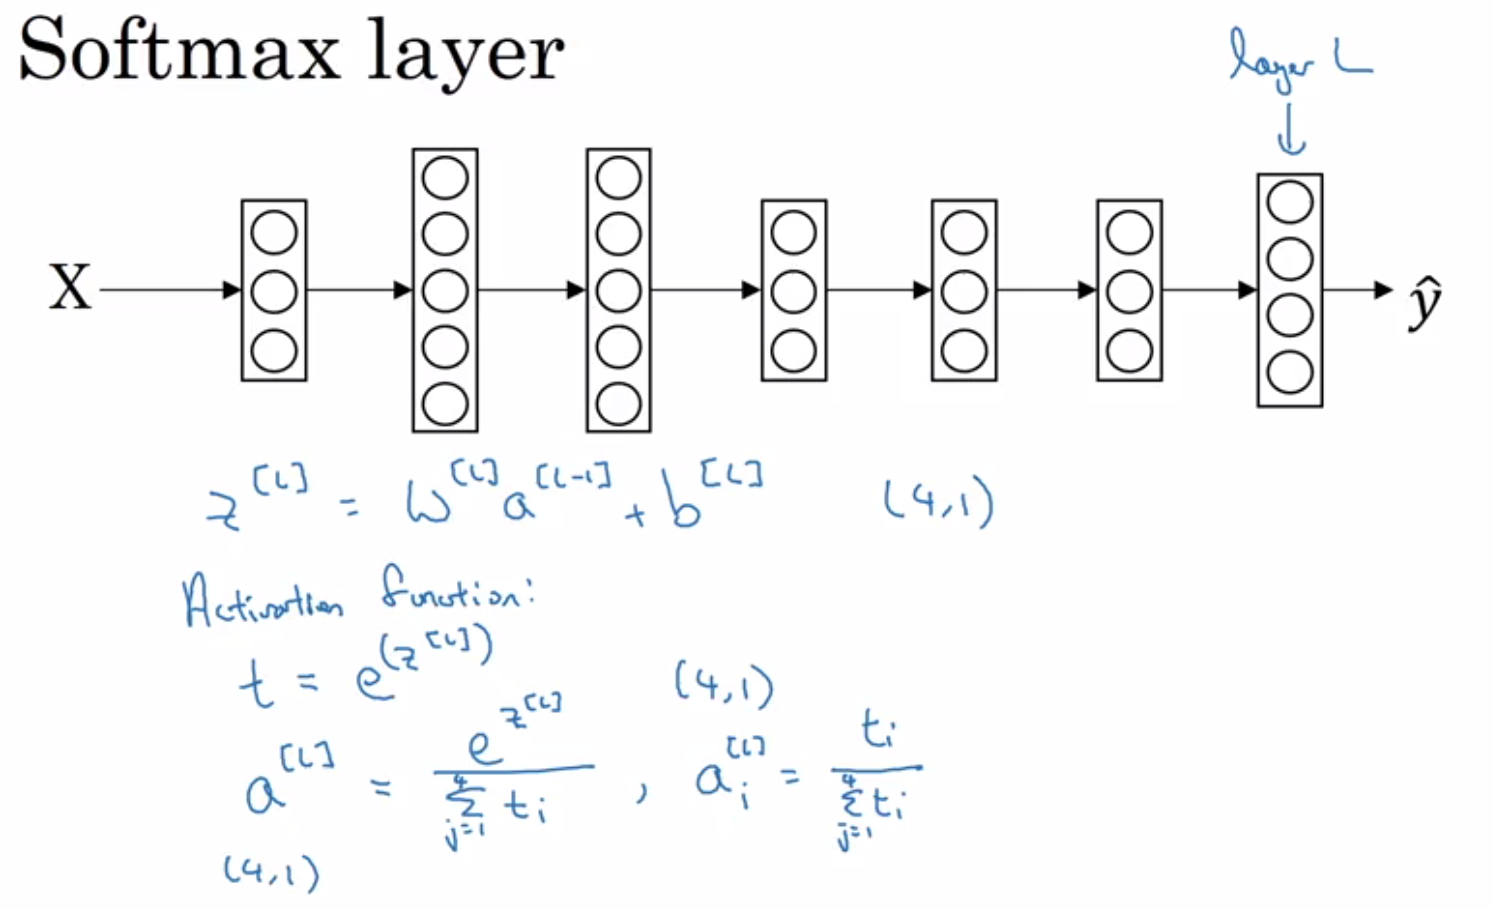
  • The output vector has dimensions (C, 1) and uses the “Softmax activation” function.
  • Softmax activation involves taking exponentials and normalizing the values.
softmax_layer
  • When C = 2, softmax reduces to logistic regression.
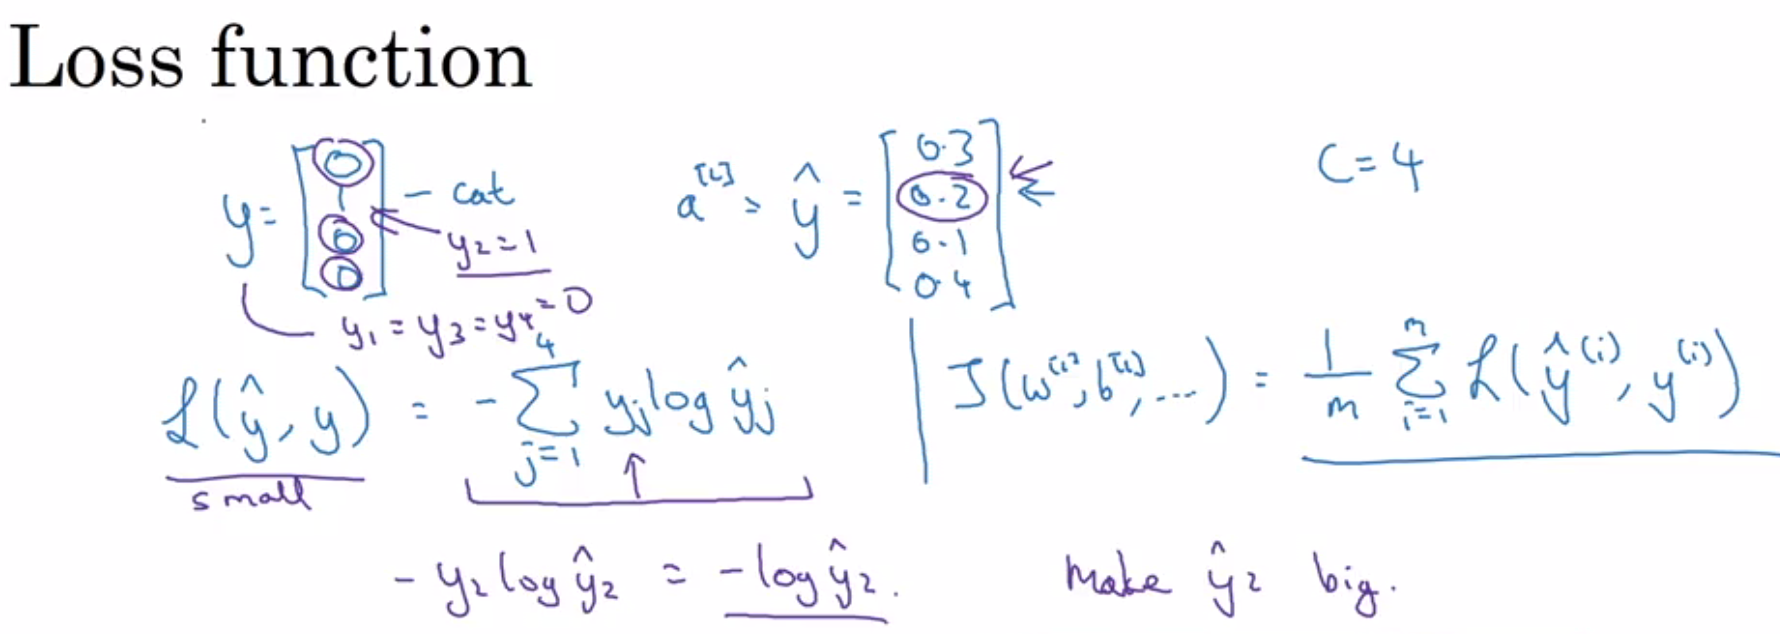
  • The loss function remains the same: cross-entropy loss.
  • Only one class will have an actual value of 1, following the maximum likelihood function.
loss_function
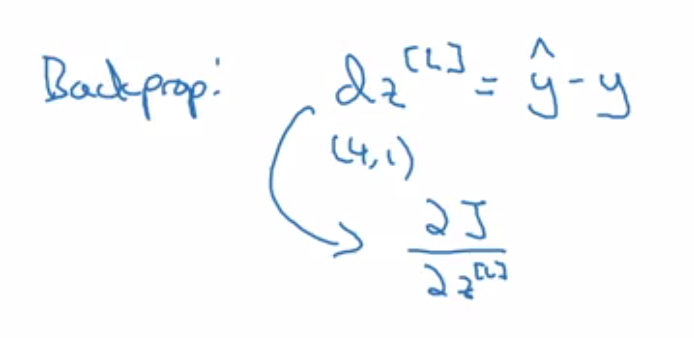
  • The gradient of the last layer is dz = Ε· – y.
backprop

Optimization for NN

Mini-batch Gradient Descent:

  • Mini-batch gradient descent exhibits oscillations during descent.
  • Choosing mini-batch size:
    • For small training sets (< 2k samples), it is advisable to use batch gradient descent.
    • For larger training sets, mini-batches of sizes such as 64, 128, 256, or 512 are commonly used.
  • Cross-validation helps in finding the right trade-off.
  • Batch gradient descent: More training time is dominated by the processing of a single duration.
  • Stochastic gradient descent: More training time is dominated by the number of iterations required for convergence.
    • Vectorization is lost in the case of stochastic gradient descent.

Exponentially Weighted Moving Averages:

  • Exponentially weighted moving averages are computed using the formulas:
    • Vβ‚œ = 0.9 * Vβ‚œβ‚‹β‚ + 0.1 * ΞΈβ‚œ
    • Vβ‚œ = Ξ² * Vβ‚œβ‚‹β‚ + (1 – Ξ²) * ΞΈβ‚œ
  • Averaging over roughly the last 10 days of temperature is achieved using the factor 1 / (1 – 0.9).
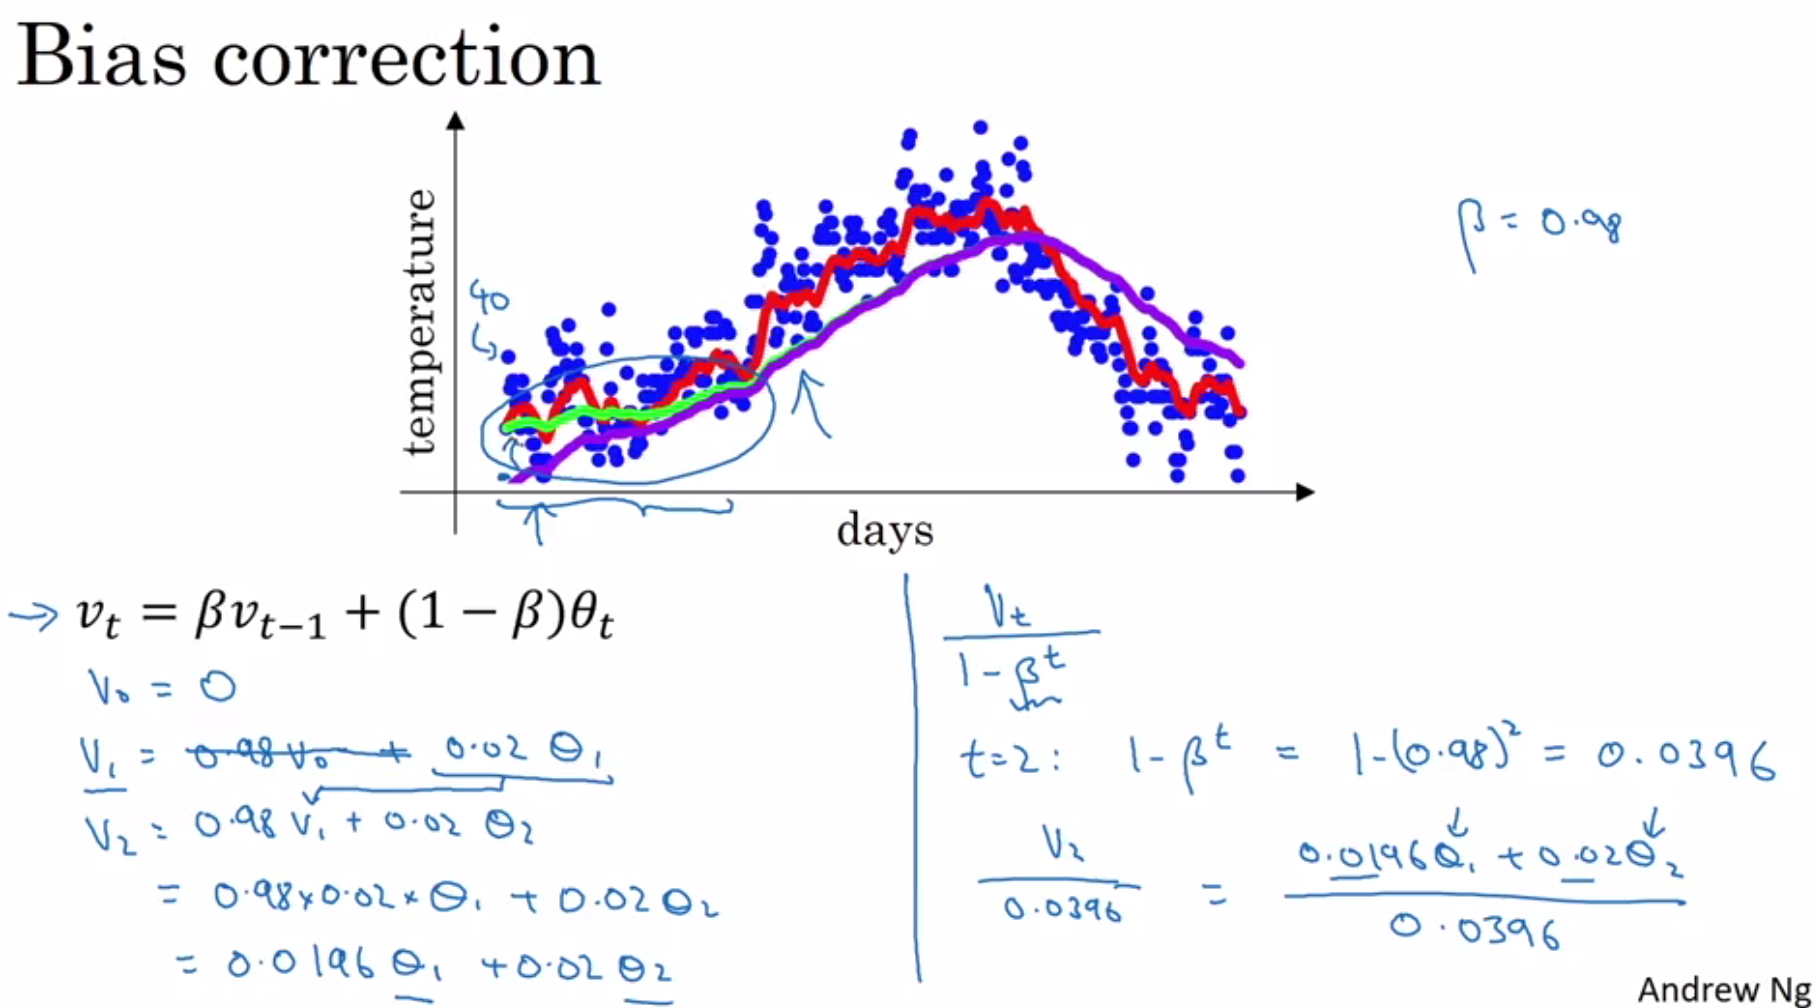
  • Bias correction is necessary to eliminate the bias introduced when initializing with vβ‚€ = 0.
  • The bias correction formula is: Vβ‚œ = (1 – Ξ²α΅—) * (Ξ² * Vβ‚œβ‚‹β‚ + (1 – Ξ²) * ΞΈβ‚œ)
bias_correction

Gradient Descent with Momentum:

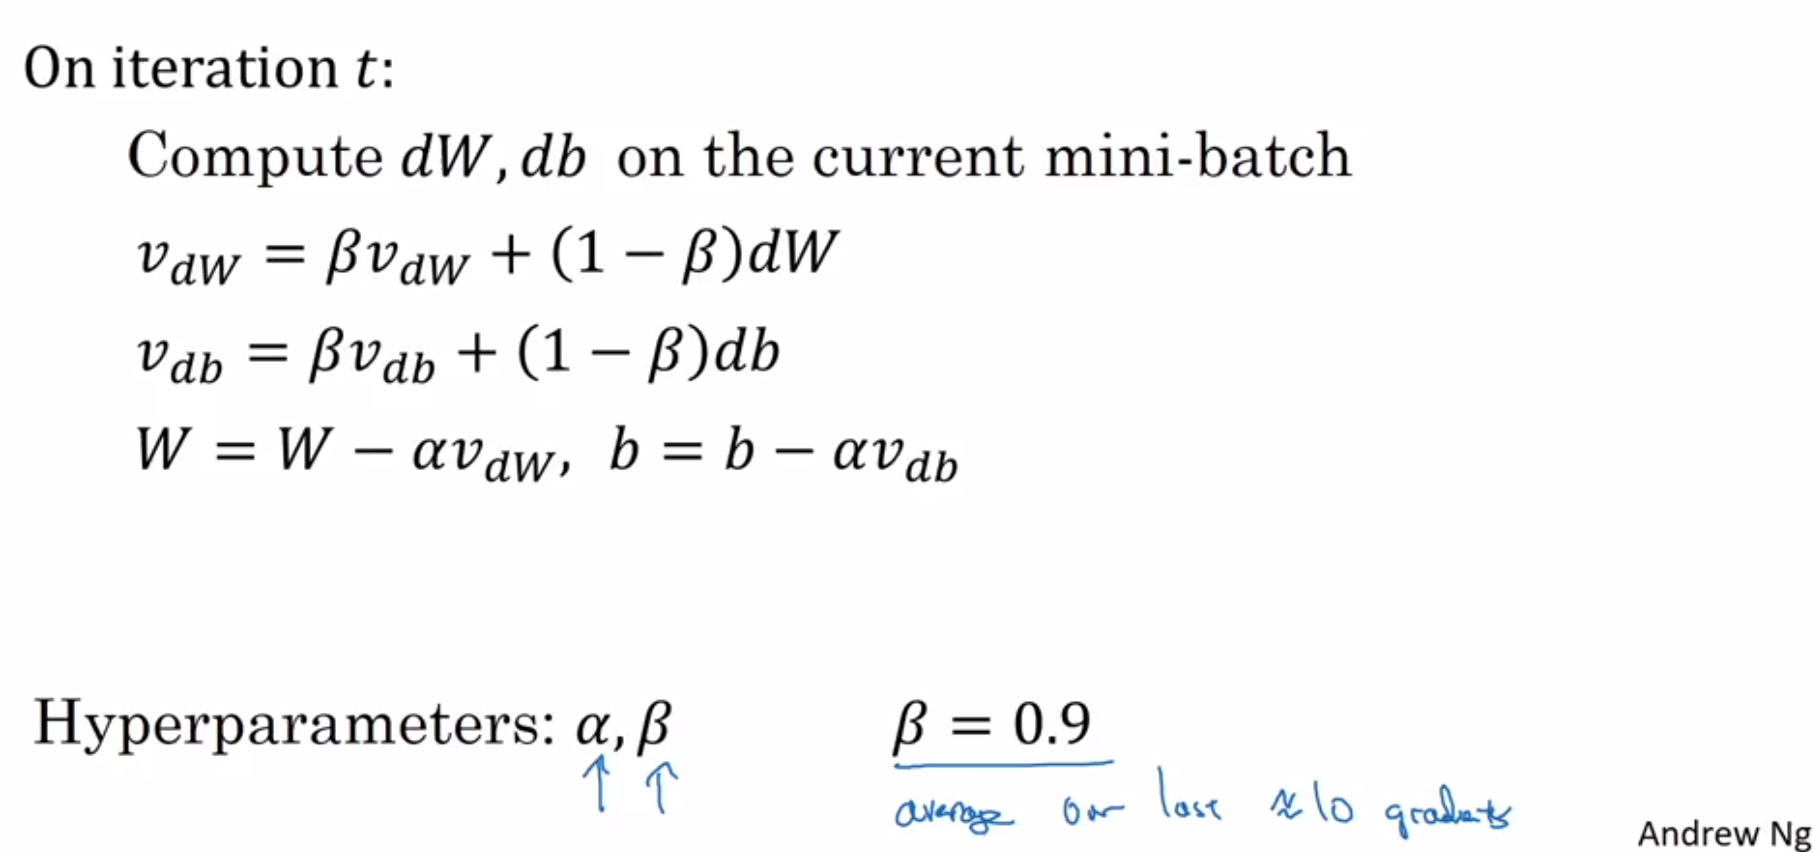
  • Gradient descent with momentum enables slower learning on the vertical axis and faster learning on the horizontal axis.
  • In practice, bias correction is not used after around 10 iterations.
gradient_descent_with_momentum.png

RMSprop:

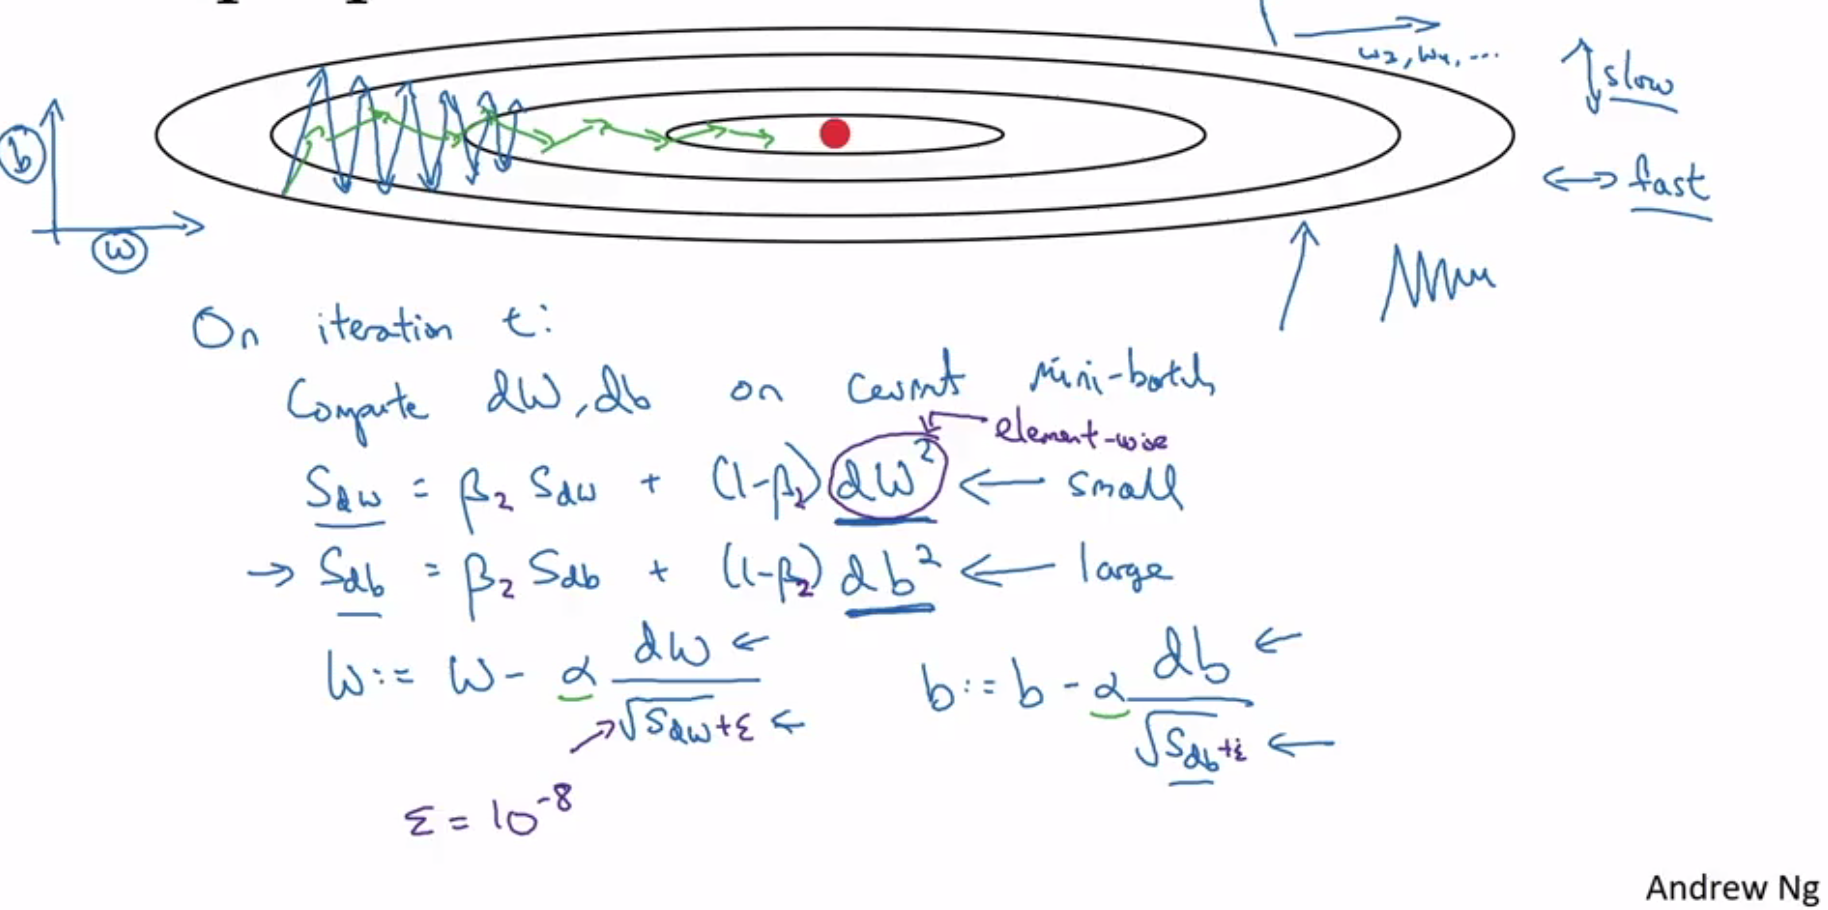
  • RMSprop is used to handle situations where some dw values can be large.
  • Adding epsilon for numerical stability helps prevent division by zero.
  • Notice is the dw^2 in the formula below
rmsprop

Adam Optimization:

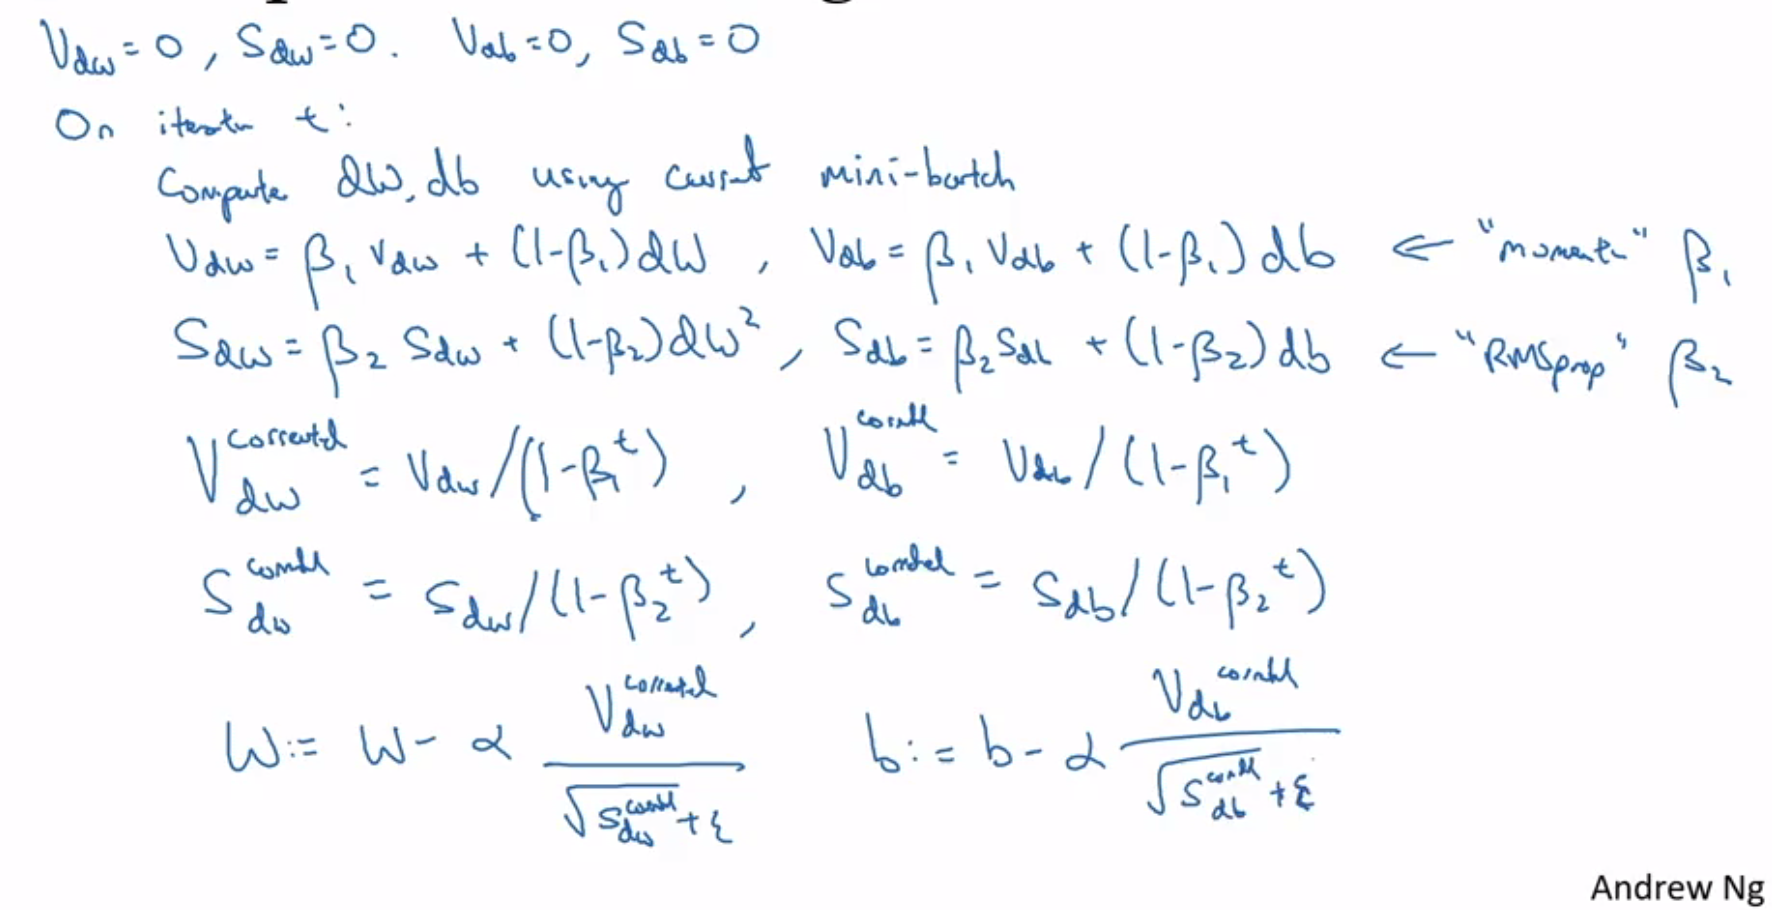
  • Adam optimization, short for Adaptive Moment Estimation, is one of the algorithms that works well across domains.
  • Default values commonly used for β₁ (0.9), Ξ²β‚‚ (0.999), and Ξ΅ (10^-8)
adam

Learning Rate Decay:

  • 1 epoch refers to one pass through the entire data.
  • In the case of mini-batches, one epoch can involve multiple iterations.
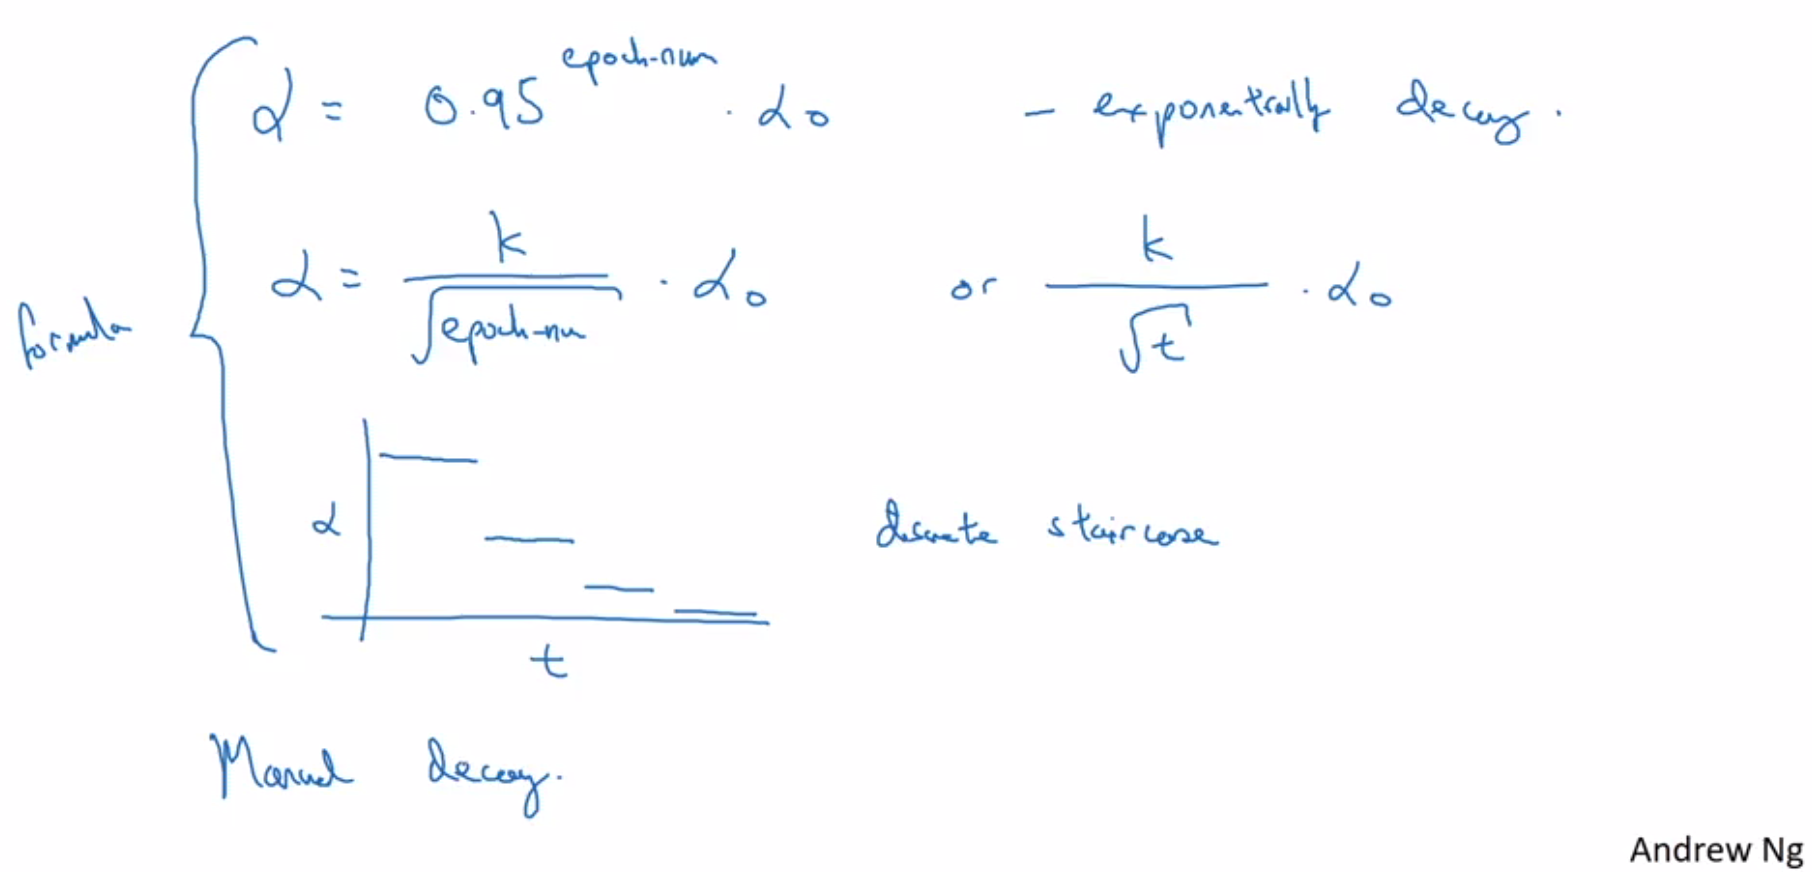
  • Different formulas are used for learning rate decay
learning_rate_decay.png

Local Optima:

  • Most points with zero gradient are not local optima but rather saddle points, especially in high-dimensional spaces.
  • Local optima are generally not observed due to the high dimensionality.
  • Plateaus can be problematic, with very small gradients leading to slower learning.

Inverted Dropout

This post is a lecture summary of the deep learning course by Andrew N. G, available at https://www.coursera.org/learn/deep-neural-network/home/welcome.

During Training:

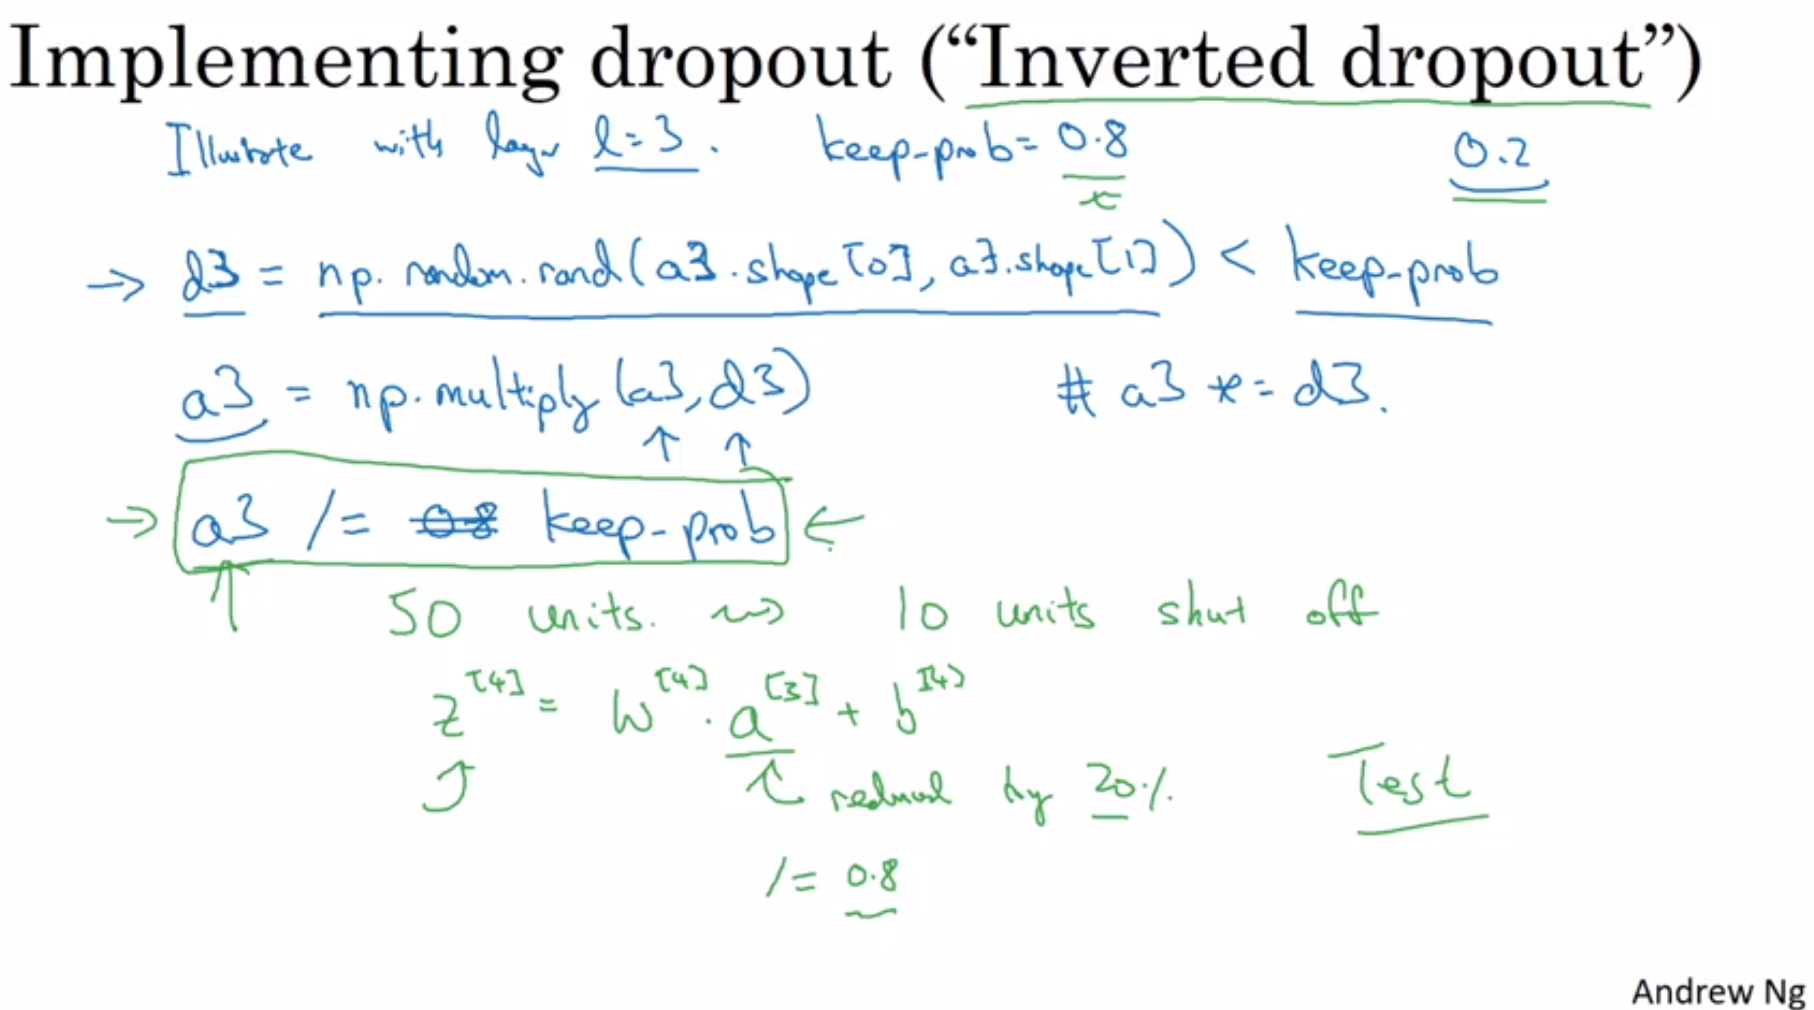
  • Neurons are dropped out by setting them to zero.
  • The activation is adjusted by dividing it with the keep probability.
  • The expected value of z[4] (as shown in the screenshot below) should not be altered.
inverted_dropout

During Scoring:

  • If “inverted dropout” is used, no additional steps are necessary.
  • Other dropout techniques may require some computations.

Intuition:

  • Dropping out neurons causes inputs to the unit to be randomly dropped.
  • This prevents the unit from relying too heavily on a single feature and encourages it to distribute weights across multiple features.
  • Different layers can have different keep probabilities.

Side Effect:

  • The cost function is not well defined.
  • It’s not possible to check if the cost is consistently decreasing every iteration.
  • A debugging tool is used to address this issue.

Solution:

  • First, verify that everything is functioning correctly without dropout.
  • Then, gradually introduce dropout.

———————————————————————–

Other Regularization Techniques

  • Data augmentation, such as horizontal flipping, random cropping, and transformations.
  • Early stopping: Stop training at a certain iteration (e.g., 7k instead of 10k) based on the error observed on the development set.

Downside

  • Balancing optimization and avoiding overfitting can be challenging.
  • Mixing both objectives requires careful consideration.

Advantage

  • Unlike L2 regularization, dropout does not necessitate trying different lambda values repeatedly.

Hidden Markov Models

From a Clustering Perspective

This section summarizes a lecture from the University of Washington [0] on clustering time series data, considering the significance of both the data and indices.

Other potential applications include:

  1. Honey bee dance: Bees switch from one dance to another to convey messages.
  2. Conference conversations: Segmenting speaker assignments based on the spoken turns.
  3. Gym exercises: Identifying exercises from pulse rate data as people switch between activities.

Model

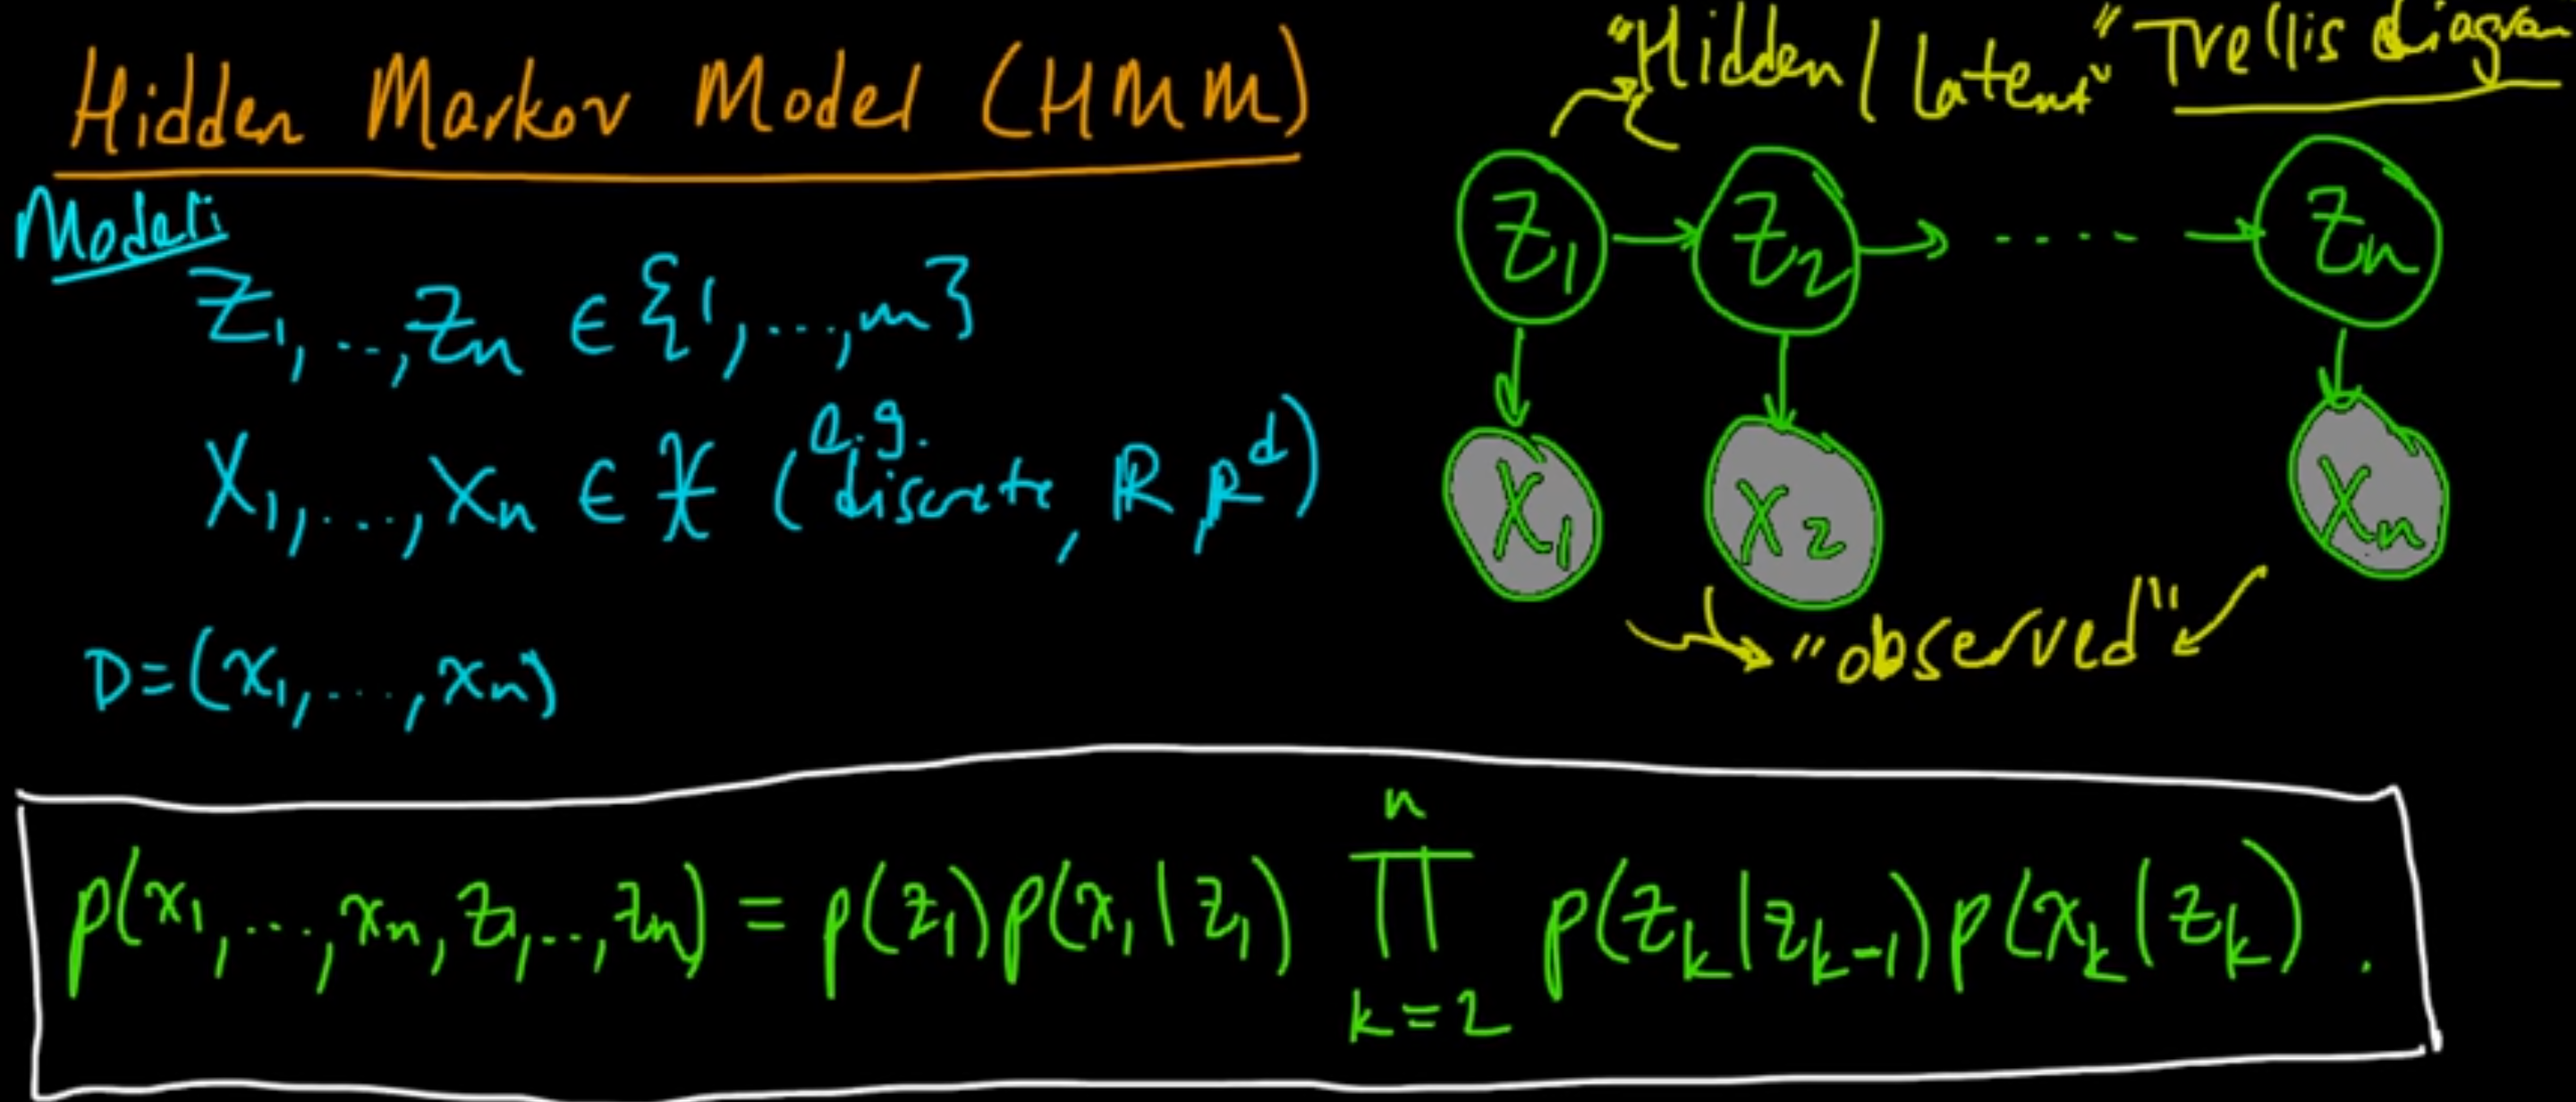
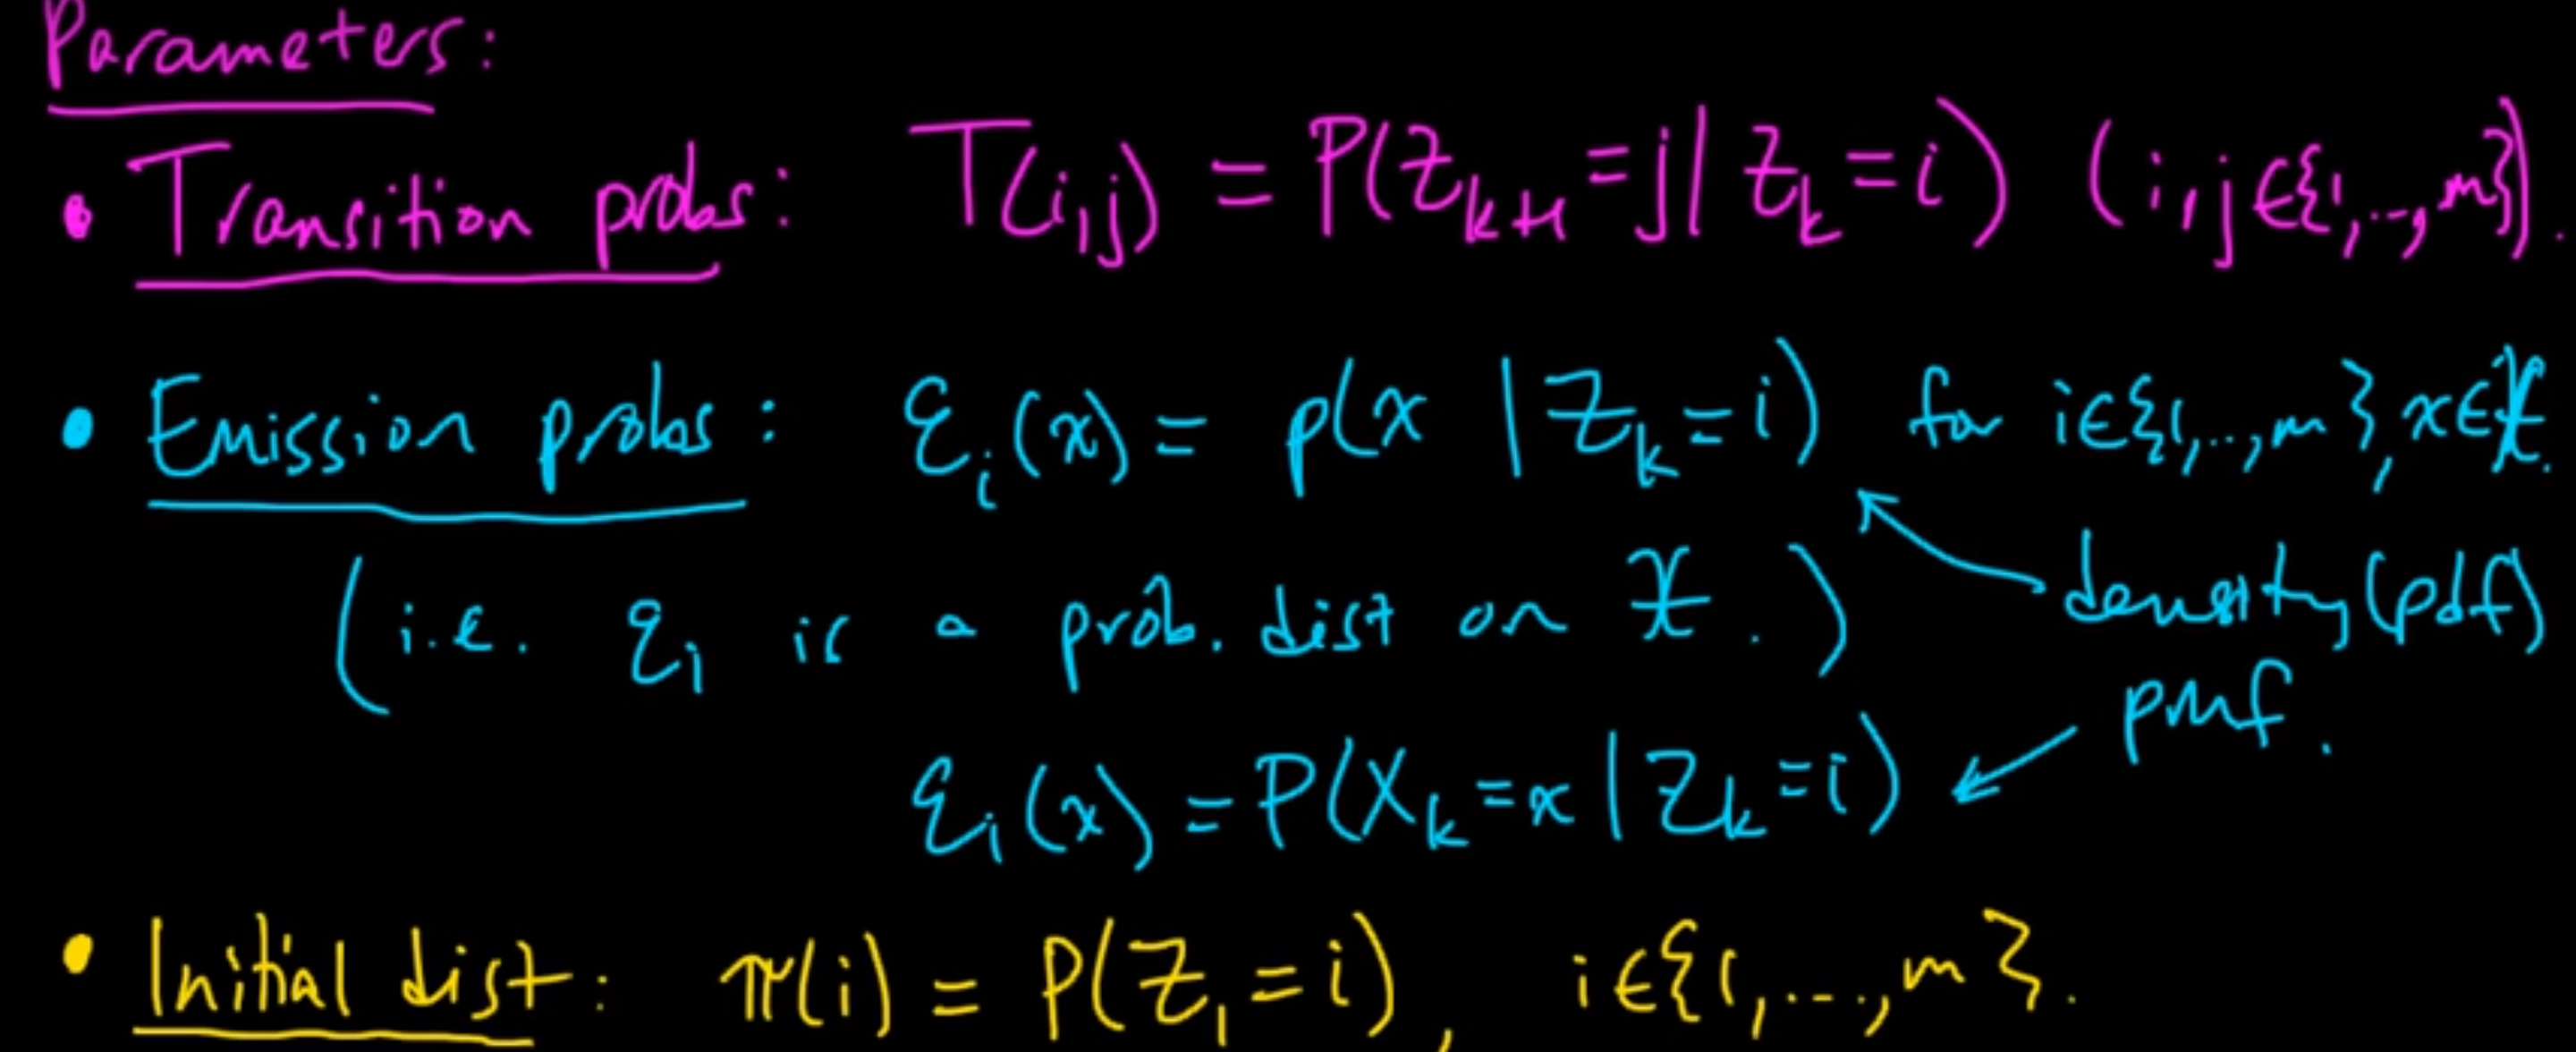
The following screenshots are from a YouTube video [1] by the Mathematical Monk, illustrating the model:

Suppose you’re developing handwriting recognition and need to recognize a hidden variable.

The prediction for “i” depends solely on the previous character being “h,” disregarding how “h” was written.

hmm_concept
hmm_parameters

Code and Notebook

You can find the code and notebook at the following GitHub link [2], which extensively explains:

  1. The structure of the model.
  2. The forward algorithm for calculating the likelihood of a given observation.
  3. The backward algorithm for finding the most probable state sequence given an observation (also known as decoding).
  4. The forward-backward algorithm for inferring model parameters from a set of observed sequences.

References

[0] : https://www.coursera.org/learn/ml-clustering-and-retrieval/home/welcome

[1] : https://www.youtube.com/watch?v=TPRoLreU9lA

[2] : https://github.com/arcarchit/datastories/blob/master/hmm.ipynb

[3] : https://web.stanford.edu/~jurafsky/slp3/A.pdf

Hierarchical Clustering

This post is a lecture summary ofΒ  course by University of Washington : https://www.coursera.org/learn/ml-clustering-and-retrieval/home/welcome


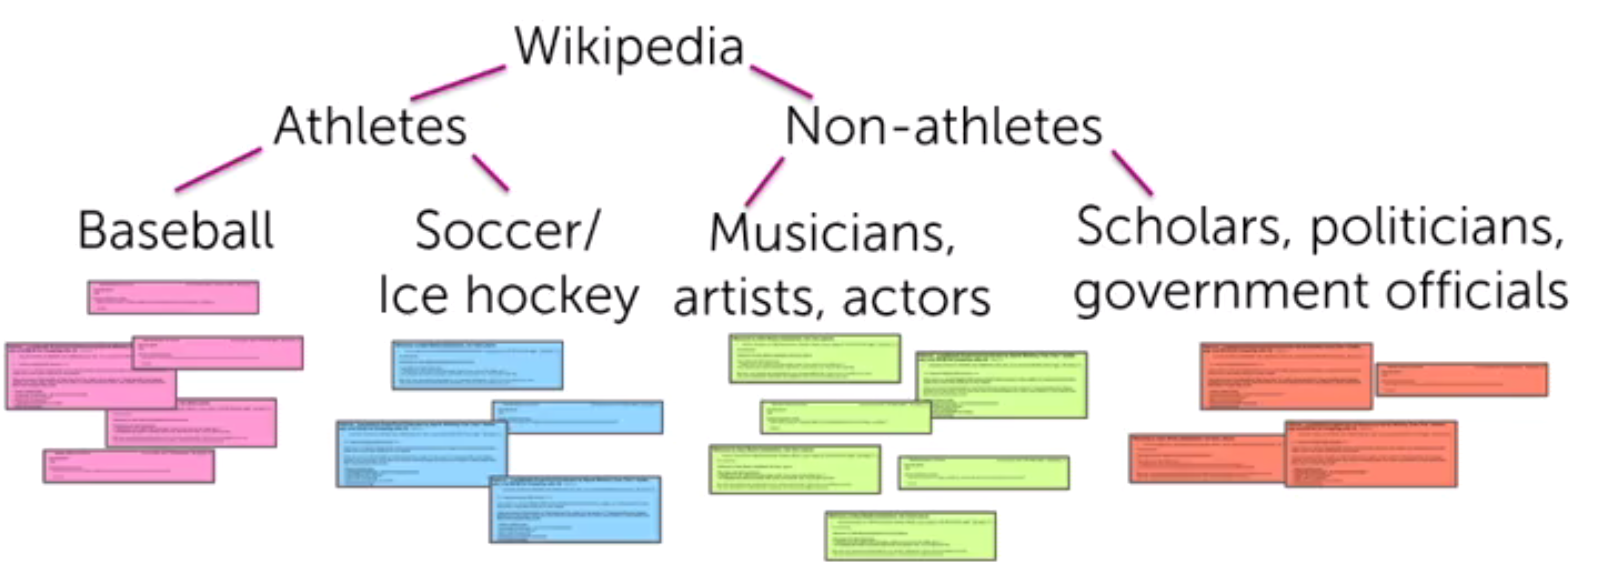
Why one might want to use hierarchical clustering ?

  • A common problem is clustering is to predefined no of clusters (k)
    • Hierarchical clustering does not need that
  • Deprogram provides effective visualization of clusters at various levels without re-running the algorithm
  • Any distance metric can work, while k-mean required euclidean distance [0][1]
  • We can construct more complex shape compared to k-means/EM


Divisive clustering

  • Example algorithm is recursive k-mean
  • We first cluster with k = 2 and then recursive apply k-means on these two clustersdivisive_clustering
  • Various choices we need to make :
    • Which algorithm to use (k-means)
    • How many split at each level (k=2, 3)
    • When to stop? Here are some heuristics:
      • Number of points in a cluster falls below certain threshold (Minimum point in each cluster)
      • Distance to farthest point falls below certain threshold (Minimum cluster radius)
      • Until per-specified no of clusters are reached


Agglomerative clustering

  • Example would single linkage algorithm
  • We start with assigning each point to its own cluster
  • Next task is how to merge this cluster
    • How do we define the distance between cluster?
      • Linkage function
        • It gives us two points from each cluster
        • Single linkage given points which has minimum distance across all possible pairs
        • Cluster A has points (a1, a2, a3) and B has (b1, b2, b3)
        • Linkage will give say (a2, b3) if it has the minimum distance across all combination
      • Distance Function
        • Can be euclidean or cosine anything
    • We merge the cluster which has minimum distance
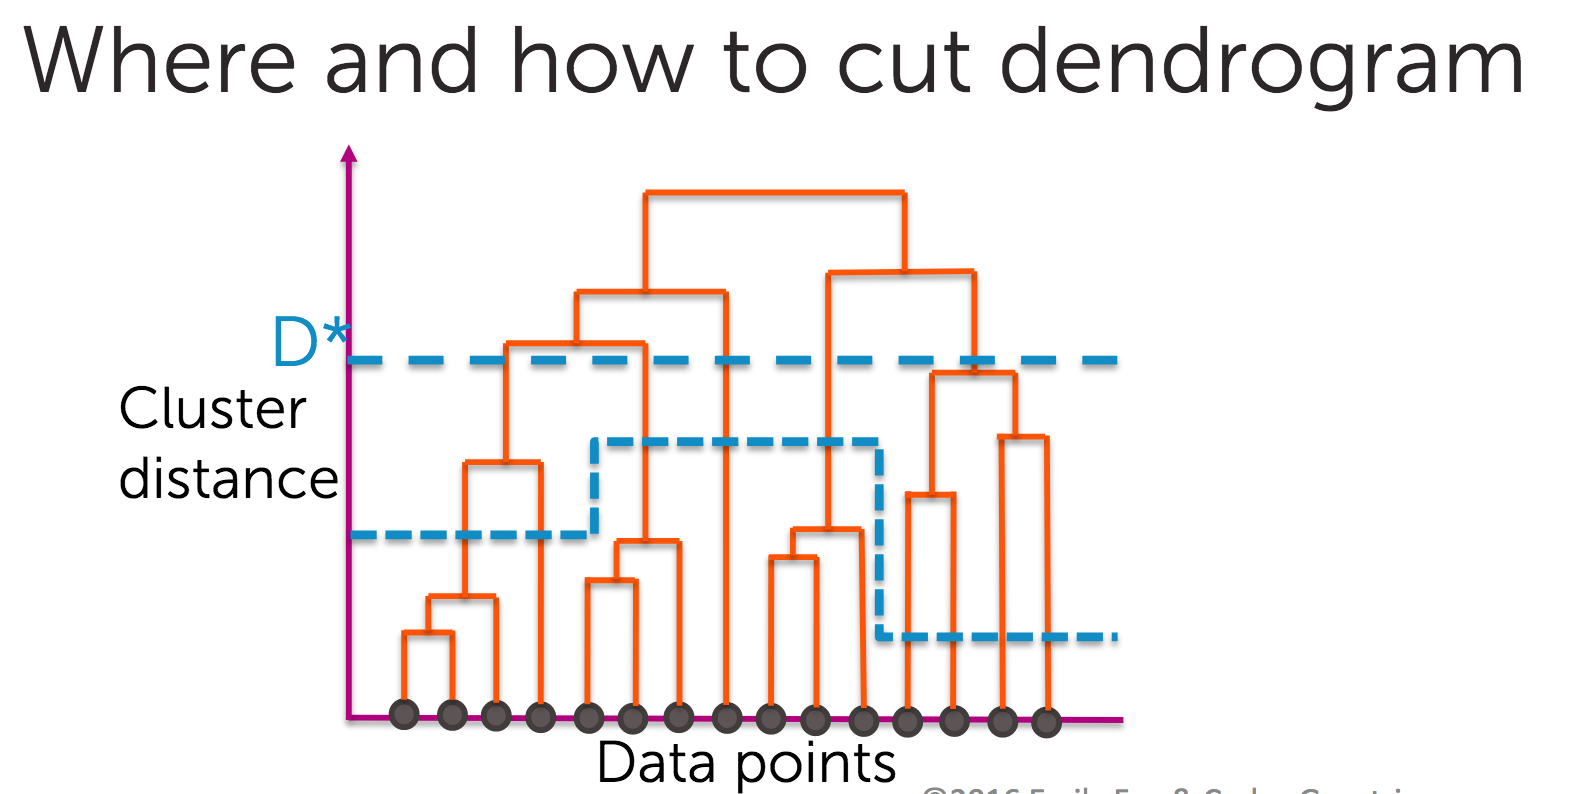
  • Dendrogram provides efficient visualization [4]
    • Data-points of x-axis carefully ordered
    • Height (y-axis) represents distance between two cluster as per specified linkage
    • It gives us the complete visualization of which nodes were merged first followed by which one etc.
  • How to cut dendrogram ? [4]
    • Suppose we are cutting the dendrogram at y=D*
    • There are no pair of cluster which has distance < D* and which is not merged
    • All the pairs of clusters having distance < D* are merged
    • D* is the minimum distance between cluster at this level
    • Distance between clusters identified > D*
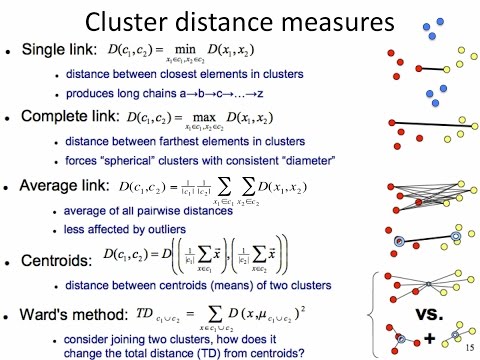
  • Various linkage functions [2][3]
    • Complete linkage takes two farthest points
    • Average linkage considers all pairs and takes an average
    • Ward linkage focus on increasing sum of squares
    • These linkage however brings down the shaping flexibility
      • Single linage would allow for complex shapes in general
      • Single linkage however can result in chaining
  • Choice we need to make in agglomerative clustering
    • Which linkage function to use
    • Which distance metric to use
    • Should we cut dendrogram flat or some weird cut

dendrogram

  • Complexity
    • For brute-force it is O(N^2 log N)
    • We can also prune search space by kd-trees or using triangular inequality
    • Best know is O(N^2) [5]


Linkage Functions

linkage

References

[0]: https://stats.stackexchange.com/questions/81481/why-does-k-means-clustering-algorithm-use-only-euclidean-distance-metric

[1]: https://pdfs.semanticscholar.org/a630/316f9c98839098747007753a9bb6d05f752e.pdf

[2] : https://www.saedsayad.com/clustering_hierarchical.htm

[3] : https://stats.stackexchange.com/questions/195446/choosing-the-right-linkage-method-for-hierarchical-clustering

[4] : http://www.econ.upf.edu/~michael/stanford/maeb7.pdf

[5] : https://www.cs.ucsb.edu/~veronika/MAE/summary_SLINK_Sibson72.pdf

Which ML algorithm to use when?

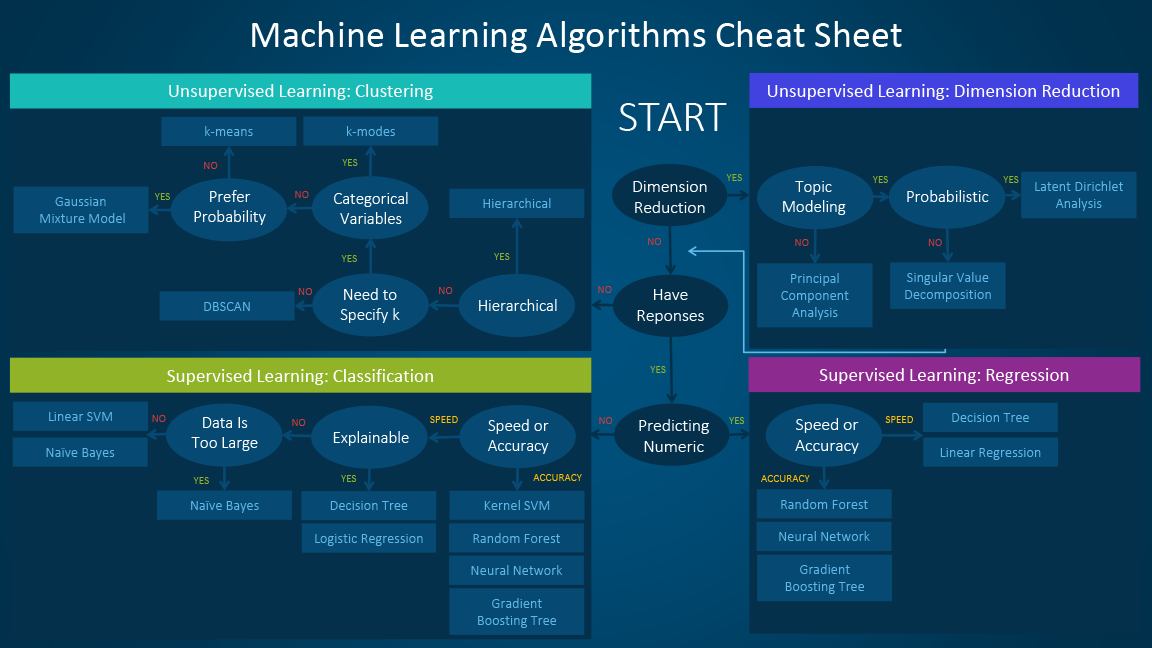
We generally find this question while starting up new project or we want to compare some algorithms to discriminate them (discrimination helps understand things better sometimes).

Although there is no definitive answer to this, I am writing here summaries from some posts. [0]


machine-learning-cheet-sheet


Factors to consider

  • Accuracy
    • Most of people focus on accuracy but it practically it is not the only
  • Training time
    • Naive Bayes and logistic regression are much faster than boosting or neural nets
  • Linearity
    • LR and SVM are suitable when classes are linearly seperatble
      • Of course SVM bypasses it via kernel trick but still not as much complex decision boundary as nueral nets
    • Despite the risk of non linearity in data linear algorithms tends to work well in practice and are often used as starting point
  • Number of parameters
    • Parameters does affect training time and accuracy
    • More parameters helps learning complex function, however it requires more data to prevent over-fitting
  • No of features
    • When data point are not enough for no of features (text, NLP) SVM works well


Notes

  • Try out linear/logistic regression, SVM first when you most dependent variables are numeric.
  • SVM
    • SVM suites more when no of data points are less for given no of features.
    • SVM is linear classifier only. It just uses kernel trick to project linearly inseparable data on high dimension.
    • SVM is solved by mathematical optimization problem unlike nueral nets. Hence tends to be bit faster.
  • What is the difference between LR and SVM?
    • LR has linear decisionΒ boundary while SVM can have non linear decisionΒ boundary.
  • Reinforcement learning
    • Analyses and optimized behavior of agent, (via feedback from environment)
    • They try to discover different actions to maximize reward
    • Trial-error and delayed reward distinguishes reinforcement learning from other ML algorithms


References

[0] : https://blogs.sas.com/content/subconsciousmusings/2017/04/12/machine-learning-algorithm-use/#prettyPhoto

[1] : https://docs.microsoft.com/en-us/azure/machine-learning/studio/algorithm-choice


Matrices Definitions

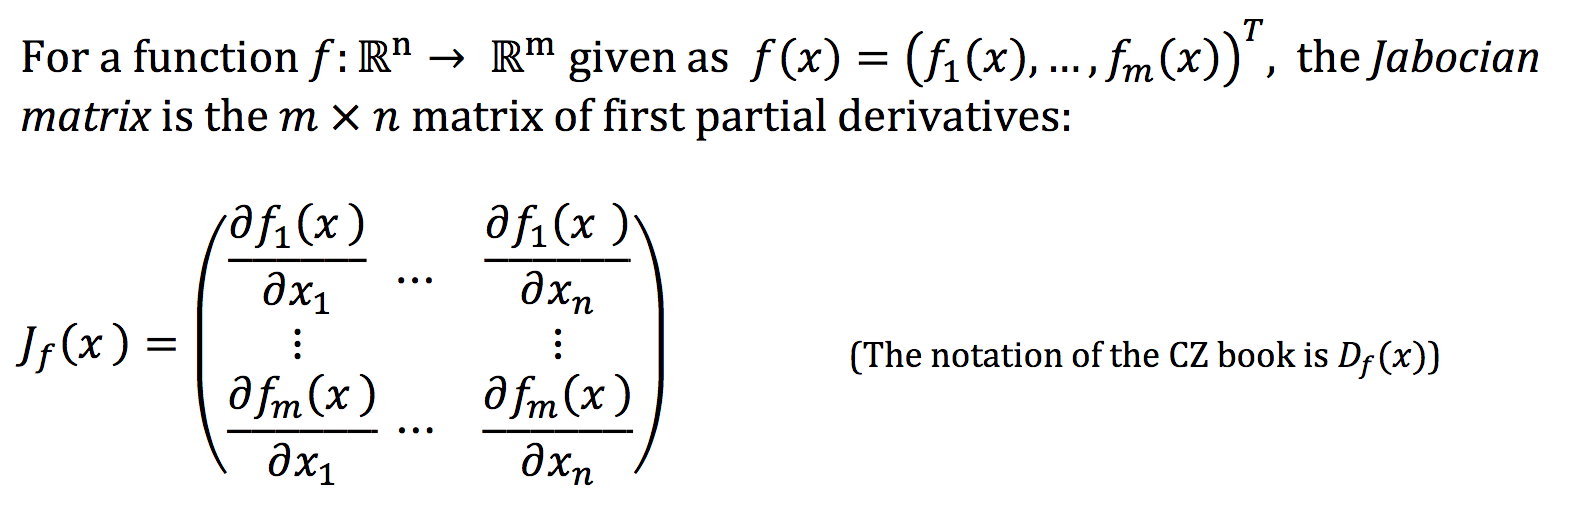
Jacobian Matrix

jscobian

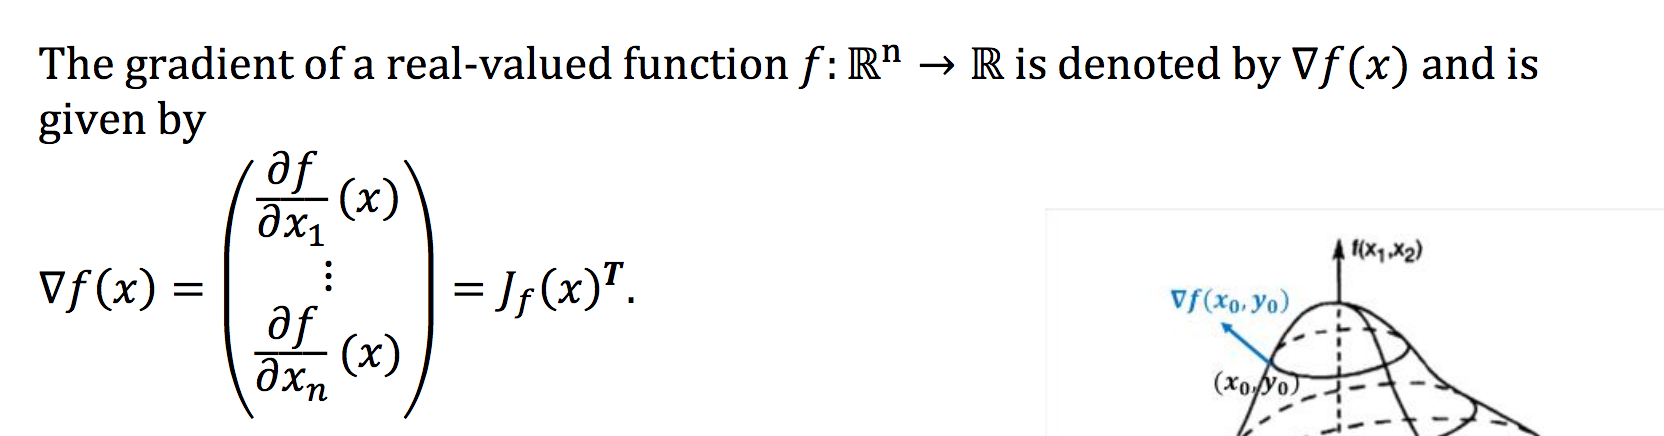
Gradient Vector

gradient

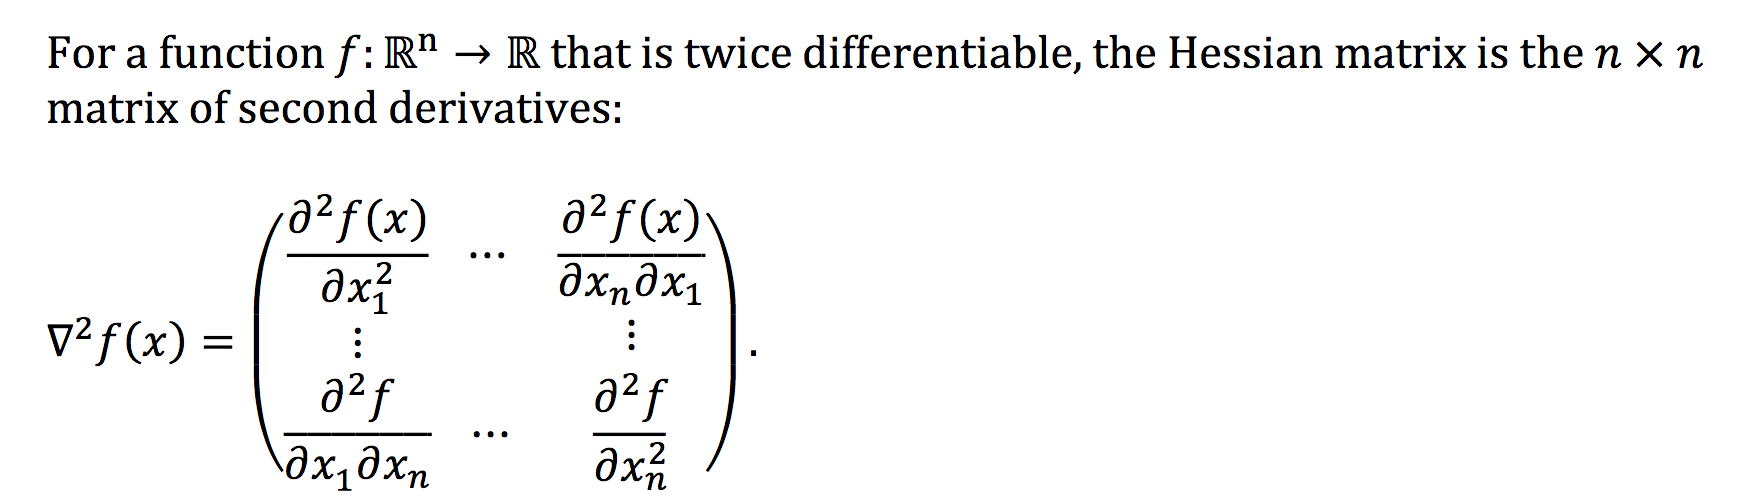
Hessian Matrix

hessian

Hessian Matrix is Jacobian of a gradient. 

Symmetric Matrix

  • Matrix and its transpose are same


Hermitian Matrix

  • Matrix is hermitian if A_transpose (A^T) = A_bar (Conjugate of complex no)

Positive Semi-definite Matrices

  • One definition:
    • Matrix M ∈ L(V) is positive definite iff
      • M is symmetric
      • v^T * M * v >= 0 for all v ∈ V
  • Now following are equal [0]
    • v^T * M * v >= 0 for all v ∈ V
    • All eigenvalues are non negative
    • There exists a matrix B such that B^T * B = M
  • Application
    • A twice differentiable function of n variable is convex if and only if Hessian of it is positive semi-definite (PSD) [2] [3]


References

[0] : https://www.cse.iitk.ac.in/users/rmittal/prev_course/s14/notes/lec11.pdf

[1] : http://www.princeton.edu/~amirali/Public/Teaching/ORF363_COS323/F15/ORF363_COS323_F15_Lec2.pdf

[2] : https://wiki.math.ntnu.no/_media/tma4180/2016v/note2.pdf

[3] : https://math.stackexchange.com/questions/946156/proving-convexity-of-a-function-whose-hessian-is-positive-semidefinite-over-a-co