[Paper] RankNet to LambdaRank to LambdaMART

Microsoft had published a paper on RankNet in 2005, which also won ICML’s test of time award in 2015. Subsequent improvement to that algorithm were lambdaRank and lambdaMART. The later had also won 2010 – learning to rank challenge. Current paper[1] summaries all three algorithms and incremental improvement they are mapping. It is written by Chris Burges who was involved in these development since RankNet.

Quick Gist

  • RankNet was trained using Neural Net.
  • RankNet was trained to minimize pair-wise differences.
  • LambdaNet was designed to maximise NDCG.
    • Which is more relevant to IR compared to pair-wise differences.
  • LambdaMART started using tree based boosting algorithms (MART, XgBoost etc)

RankNet

  • For a given query (q), we have two items (i and j)
    • I am writing down item but it would be any document (web page for example)
    • We will have features for
      • query
      • item
      • query item pairs
  • For both (q, i) and (q, j) we pass them through NeuralNet and get scores -> si and sj
    • We will also pass pairs which has same supervised label
  • We need to decided a loss function based on si and sj, gradient of which we will back propagate.
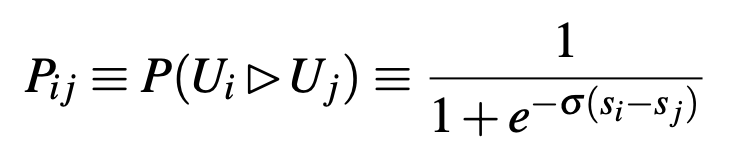
  • Computed probability formula y_hat
  • Supervised probability label y = (P_ij_bar) = (1 + S_ij) / 2
    • S_ij = { 0, 1, -1}
      • 1 if ( i is more relevant then j)
      • 0 if (i is less relevant then j)
      • 1/2 if both have same relevant scores
    • y will be in {0, 1/2, 1}
  • sigma determines shape of sigmoid
    • We would go to difference of (si – sj) on x-axis and read corresponding value from y axis.
    • sigma determines steepness around 0
    • This technique is known as temperature scaling. In tower network people use is when passing cosine similarity value to sigmoid.
    • Technique is useful when input has limited range
      • Cosine similarity has range (-1, 1)
      • s_i – s_j would also have smaller range
  • Cost function is cross entropy
  • One observation here is that when si = sj
    • cost = log 2 > 0
    • Document with different label but same score are still pushed aways from each other.

Speeding up RankNet Training by factoring

Defining lambda_ij
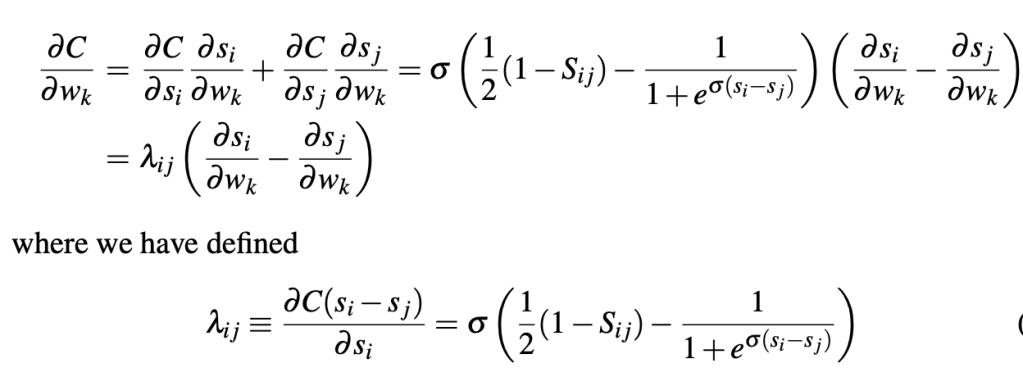
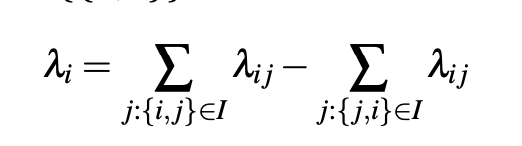
Defining lambda_i

  • What speedup did we achieve
    • Earlier for a given query we were computing lambda_ij for each pair and updating weights
    • Now we are computing lambda_i for each document and then update weight for given query
      • You can correlate this to going from SGD to mini-batch
      • We can do SGD at query, pair level or query level. We choose later.
  • Intuition of lambda_i
    • Direction(+Ve/-Ve) and magnitude where we want document to move
      • Move up/down in the ranking

LambdaRank

Figure below and caption explains why reducing pairwise difference does not necessarily results in increase of IR metrics. And LambdaRank is a way to optimize for IR metrics faster.
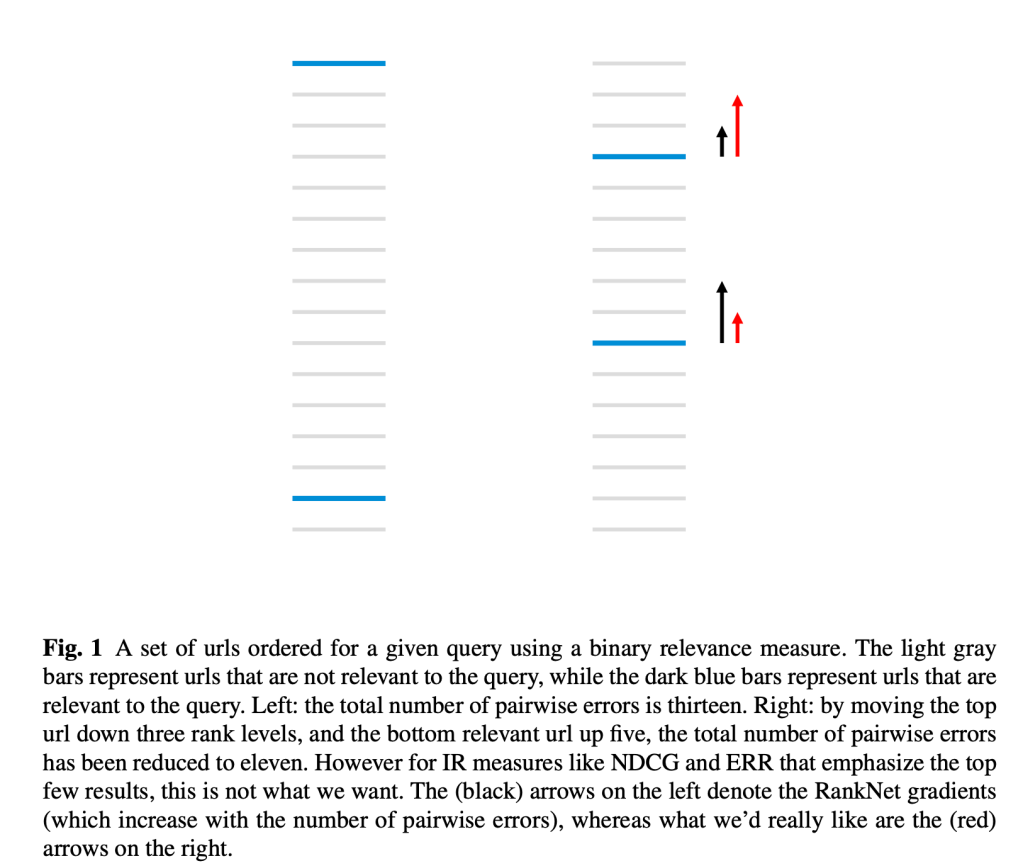
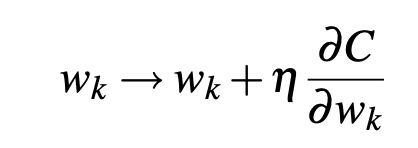
LamdaRank modified lamda_ij equation empirically as follows and it seemed to work well. We could do this because we don’t need to know actual cost function as long as we compute lamda_ij and then lamda_i

This becomes maximisation problem so we move in direction of gradient.
LambdaMART

  • MART – Multiple Additive Regression. Trees. For more info read the post on gradient boosting
  • To work with MART we need to specify two things
    • Gradient of loss function, which will be used to fit the trees
    • For the region in tree compute leaf value, that is done using line search/newton’s method
  • We had empirically defined lambda as gradient in lambdaRank, we use same lambda as gradient here as well.
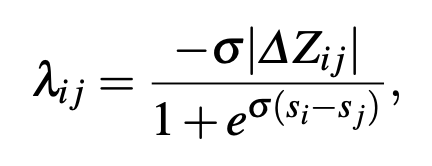
  • For above lambda gradient, paper defines empirical cost function and then derives value at leaf nodes using newton’s method.

  • Key difference to observe between lambdaRank and lambdaMART
    • Lambda rank updates all weights (of classifier) after each query is examined
    • Leaf value at lambdaMART is computed for all query, item pairs that falls into that leaf
      • This allows lambdaMART to update splits and leaf values such that it may decrease utility for some queries but overall utility increases.

Reference

[0] : https://www.microsoft.com/en-us/research/blog/ranknet-a-ranking-retrospective/

[1] : https://www.microsoft.com/en-us/research/uploads/prod/2016/02/MSR-TR-2010-82.pdf
On Interleaving

This post summarises some concepts around interleaving. Take away for me in the topic is realisation that in some cases interleaving can be conclusive while a/b test is not. (examples of search improvement on small % of queries) and the intuition that why it converges faster. Also there is a broader topic – design of experiments. It is generally used in search systems and recommender systems. Both can come under umbrella of retrieval systems.

What is interleaving ?

  • It is a method to evaluate ranking system.
  • If we want to measure effectiveness of two ranker, we prepare a merged list and observe customer’s interaction on that.

Why do we need interleaving ?

  • It allows us to experiment faster.
    • It converges faster than a/b tests
  • For search systems many times a/b test might not converge at all
    • Say an improvement is affecting small % of search queries
  • Search system has low convergence say 4 %. How to measure algorithm that improves 0.5 % on top of that.
    • Lots of impressions are needed for convergence in a/b test.

Illustrative Examples

  • Shoe
    • Suppose for a given shoe design we have two compelling soles, we want to measure which one has better resistance to wear/tear
    • We have 100 people to test on
    • option 1 – classic a/b test
      • 50 people get each type of shoes
      • Two variability
        • How active the person under tests it
        • Quality of sole
    • option 2 – interleaved test
      • Different sole in left and right pair of shoe
      • Just one variability
        • Quality of sole
  • Soda [0]
    • We want to test what is more popular among population – Pepsi or Coke ?
    • option 1 – classic a/b test
      • Split population into two groups
        • One group receives Pepsi
        • Another one receives Coke
      • Measure soda consumption between two
      • Variability
        • Wide variation in soda consumption habit
        • Heavy soda consumer would be small % of population but large % of contributor
    • option 2 – interleaving
      • Allow people to choose either Pepsi or Coke.
      • Don’t mark a label, but can be visually distinguishable

For some tests interleaving is not possible.

  • In the shoe examples instead of sole, if we have two different design of shoe
  • In search systems, if you are changing some UI elements

Two tests Netflix did while introducing new interleaving system

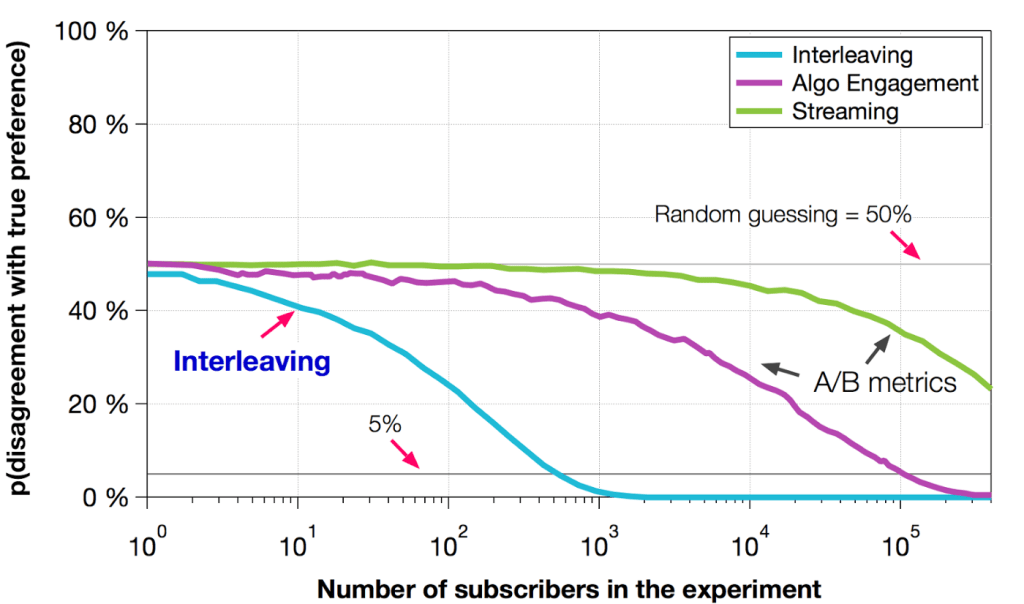
  1. Compare sensitivity against traditional a/b tests [0]
    1. Before the test it was known that algorithm B is better than A
    2. They measure no of impressions it took to converge

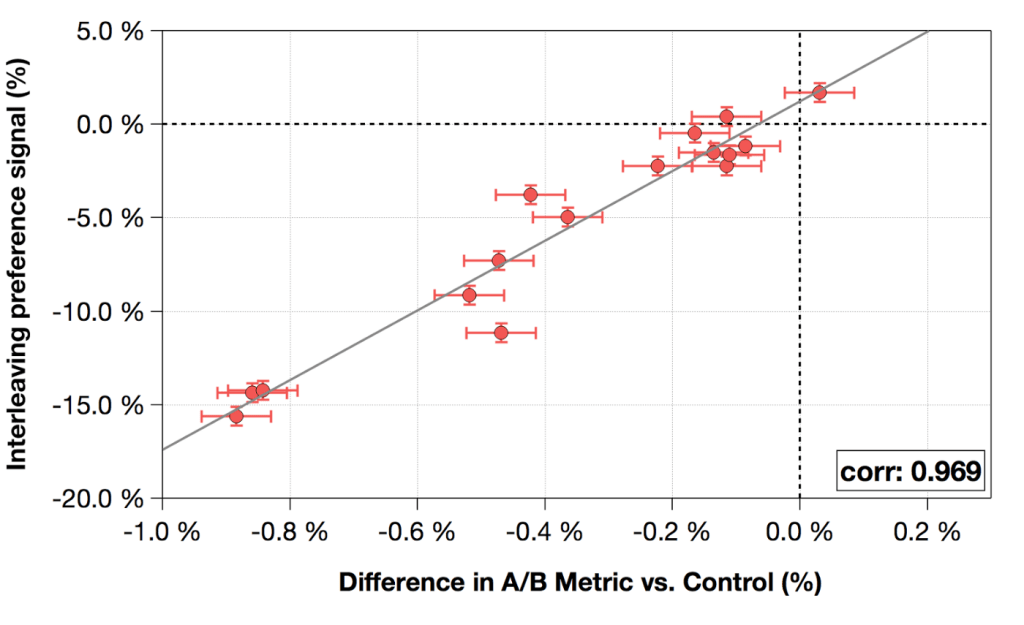
2. Correlation of interleaving result with a/b tests [0]

On Metrics

  • Search systems have business metric like conversion & revenue
  • Netflix has business metrics like retention and streaming hours

Reference

[0] Netflix blog

[Paper] Semantic Product Search

  • Paper is related to search systems for e-commerce.
  • Shortcoming of BM-25
    • lack of understanding of hypernyms, synonyms, antonyms
      • hypernym – general/broad word
      • Color is hypernym for red
      • Examples
        • Red dress and burgundy dress
        • sneakers and running shoes
    • Morphological variants (woman vs women)
      • Stemming and lemmatization is typical solution
      • Requires numerous hand-crafted rules
        • Converts reading glasses to reading glass
    • Sensitivity to spelling error
      • Typically solved by spell correction algorithms

Architecture

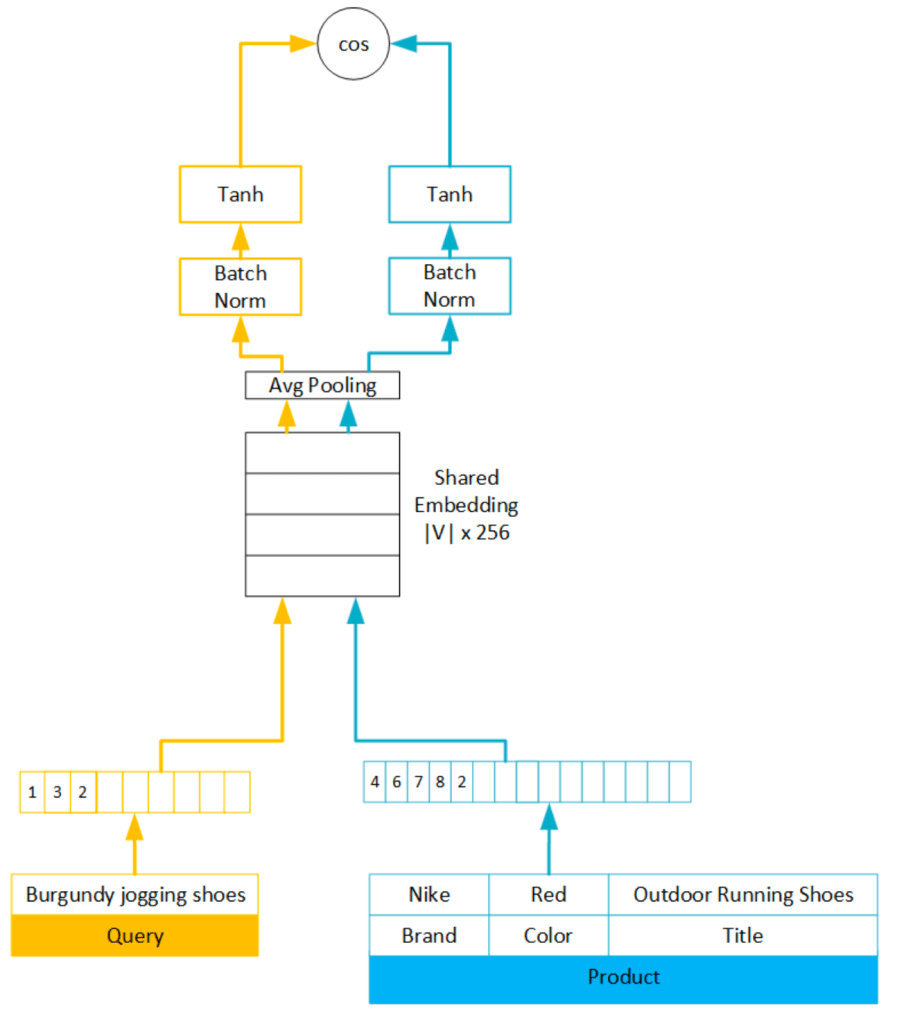
  • Sharing embedding layer in siamese network work well, capturing local word level matching even before training this network.
  • Average pooling
    • Comparing to LSTM performance of average pooling reduced by just 0.5 %
    • Evaluation metric were MAP and Recall@100
    • It helped computationally
    • Unlike web search query and items titles have smaller length
    • Query also does not have stop words
  • Batch Normalisation
    • Length of items are generally longer than query
    • They had observed difference in magnitude after avg pooling of query and item
    • I have seen people using FC layer instead to have separate parameters

Loss Function

  • They first tried with 2 part hinge loss
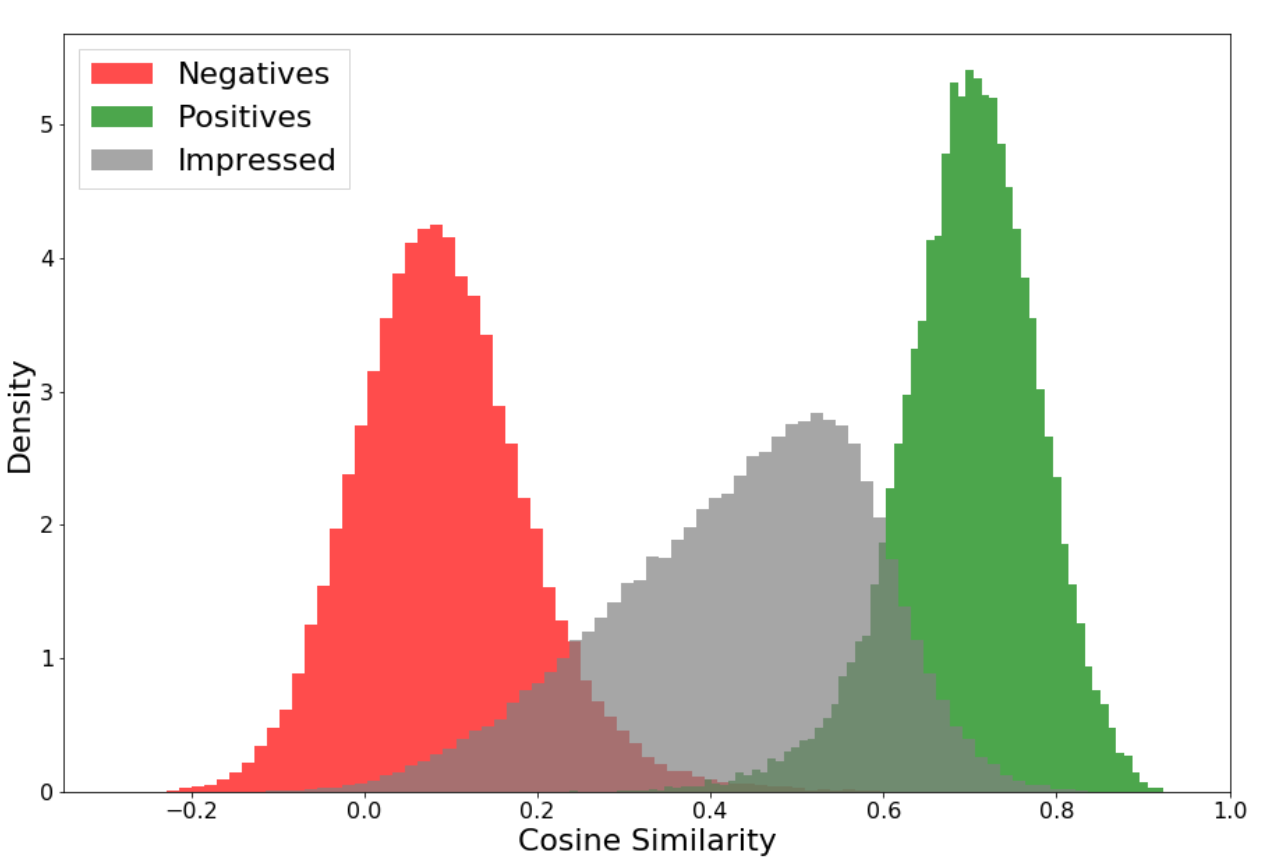
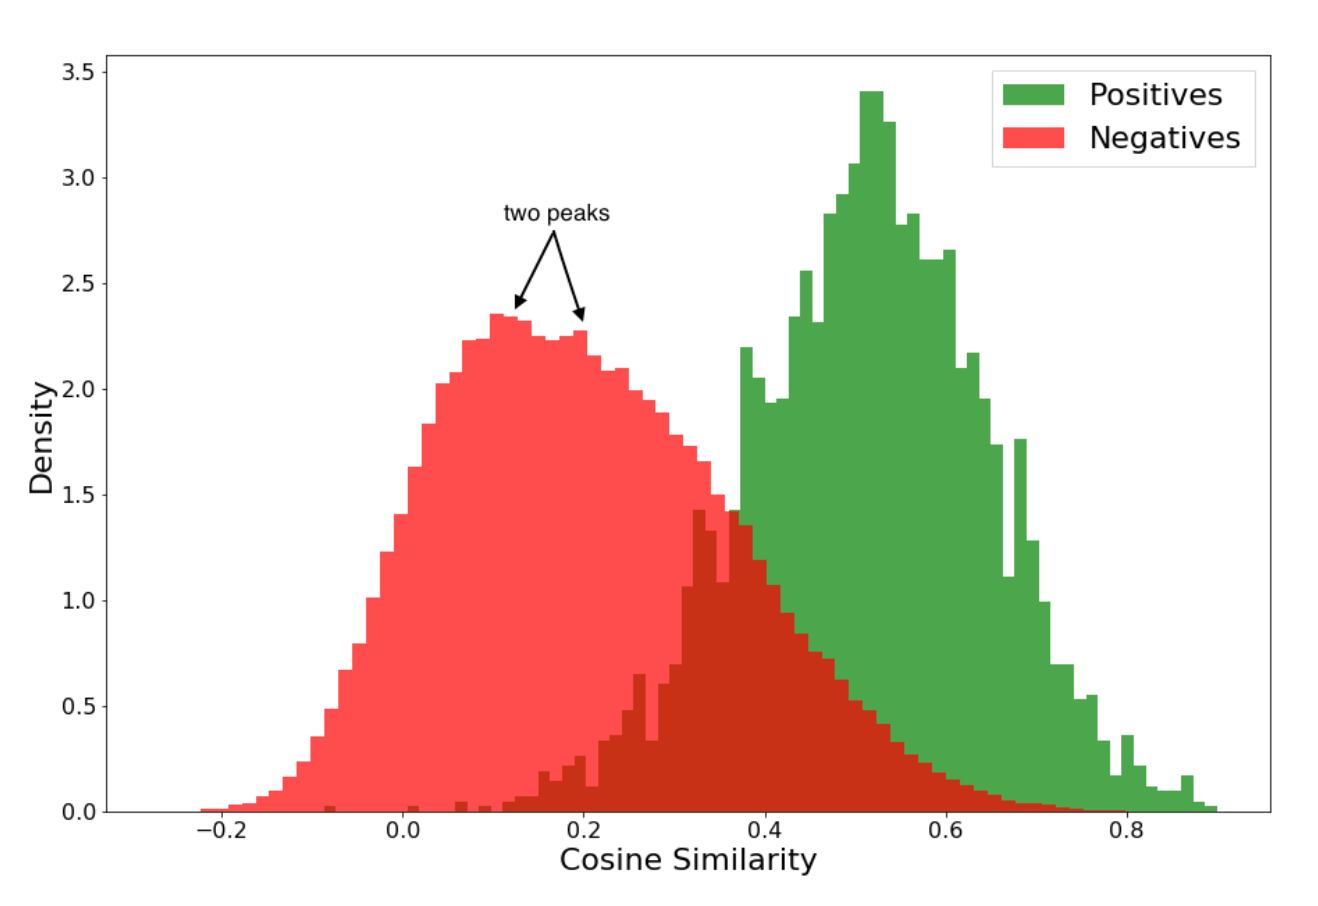
  • Analysing the overlap items they found that they were clicked but not purchased.
    • They note that from matching standpoint these products are okay to show to customer
  • So they introduced third term and decided it’s threshold to be 0
  • EmpIrical values used episolon (+) = 0.9, episilon (-) = 0.2
  • My view on this
    • For the products that has clicks but not orders, new loss tries to keep it below 0.55
    • 2 part hinge loss was for purchased vs random items
    • Some of those random items had got clicks
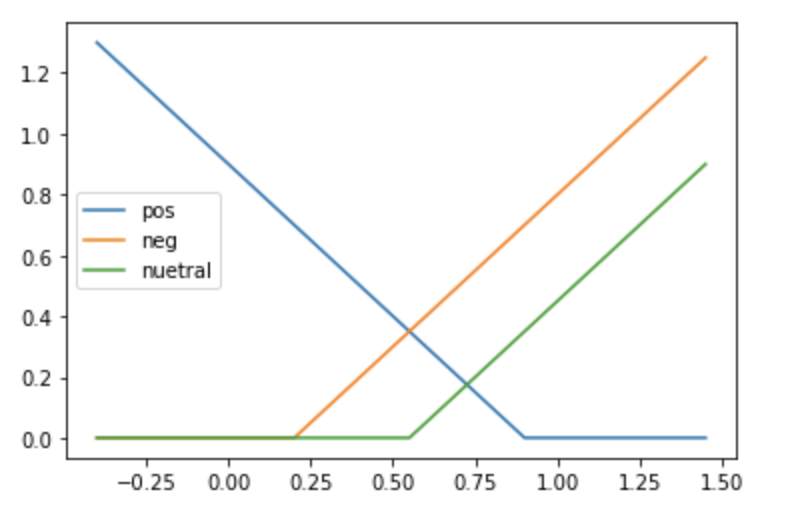
    • For positive items when we get similarity above 0.9 it should contribute 0 to loss
    • For negative items if we get similarity below 0.2 it should contribute 0 to loss
    • For neutral items if we get similarity below 0.55 it should contribute 0 to loss
  • y_hat is cosine similarity
    • Based on which loss is calculated
    • Instead of passing cosine similarity to sigmoid they are passing it through hinge function.

Tokenization Methods

  • Word unigram
  • word n-gram
    • To preserve information about word ordering
    • They preferred word n-gram over LSTM or CNN
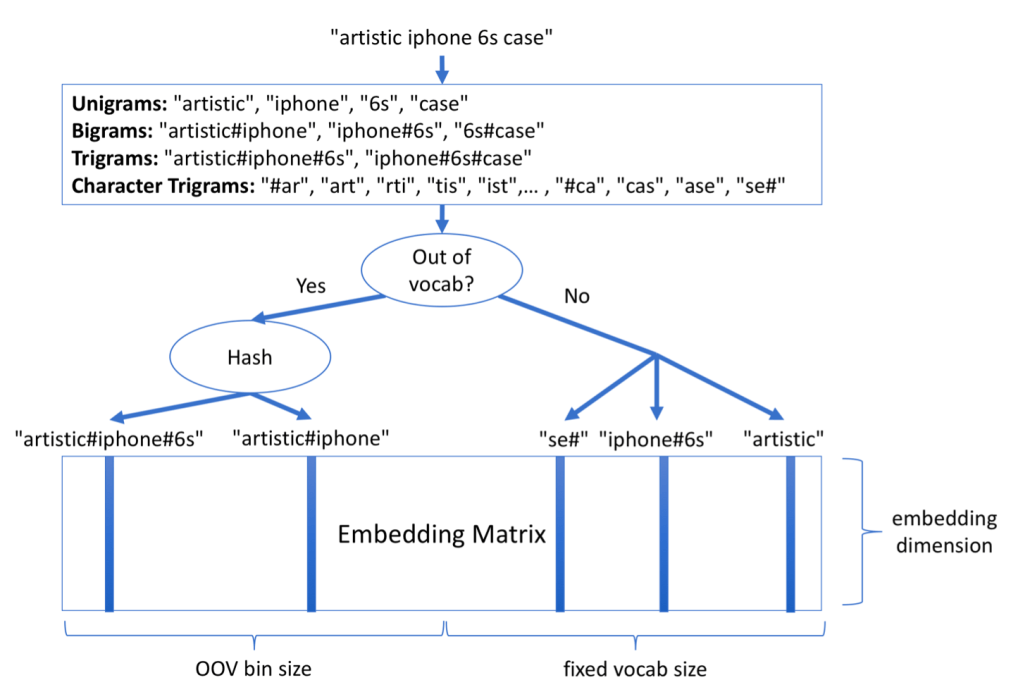
  • Character trigram
    • Robust typos (iphone & iphonr)
    • Compound words (amazontv & firetvstick)
    • Item parts and sizes
      • Tires have different sizes
      • TVs have different model
  • Handling unseen words
    • Common NLP techniques
      • Mask the input
      • use same embedding for all unseen words
    • What they choose
      • Keep more embedding space for unseen words
      • Hash them to get the bucket
    • Enough space is allocated for frequent words and they are not hashed
      • 10k or 100k of n-grams are kept
  • Combining tokenization
    • One approach
      • Separate embedding for unigram, biagram and character trigrams
      • Compute. weighted sum of cosine similarity individually
    • Their approach
      • Consider them as bag or words

Data

  • Time range
    • Training data – 11 month
    • Eval data – 1 month
  • Trick of aggregating count as weight
    • Weight while computing the loss, simple multiplication ( I had done that in synonyms as well )
    • 54 billion query product training pairs
    • Reduced to 650 million
  • Ratio
    • 1 purchased
    • 6 impressed
    • 7 random
    • They plan for both matching and ranking
    • Matching -> Differentiate between (purchased + impressed) from random
    • Ranking -> Differentiate between purchased and impressed
  • Query Preprocessing
    • Changes queries to list of token IDs
    • array length = 99 % tile of query token length
    • Smaller tokens are padded to right
  • Item preprocessing
    • One approach
      • Embed every attribute independently and concat
    • Their approach
      • Ordered Bag of words for title and attributes
      • Issue was variability in attributes and lack of structured data across items

Model Evaluations

Evaluation Metrics

  • Matching
    • Recall@100 and MAP
      • Used for tuning model hyper parameter as well
    • 20k queries and sub-corpus for those queries
      • Around 1M items
      • Ordered + Impressed + Random
  • Ranking
    • NDCG and MRR
    • Purchased + Impressed

Evaluation Results

  • Table 1
    • L2 variant of hinge loss outperforms L1
      • They hypothesise that L2 is more robust to outliers
    • 3 part hinge loss outperforms 2 part in matching but not in ranking
      • Introduction of 3rd part forced purchased and random to be more separated
  • Table 2
    • LSTM, GRU vs avg Pooling for aggregation
      • Comparison is made for various losses
      • Average pooling is performing similar or slightly better
        • Definitely reduces computation time
      • Since query and product title are relatively short this works well
      • Recurrent methods are expressive but introduces specialisation between query and title
        • Some may argue it is a good thing
        • They argue that it might not capture local word level mapping
  • Table 3
    • Compares different tokenization methods
    • Vocab sizes in embedding space
      • 125k – unigram
      • 25k – bigram
      • 64k – character trigram
      • 500k – Out of vocabulary (OOV) bins
    • Advantage of adding bigrams
      • Example – Chocolate milk vs milk chocolate
    • Advantage of character trigrams
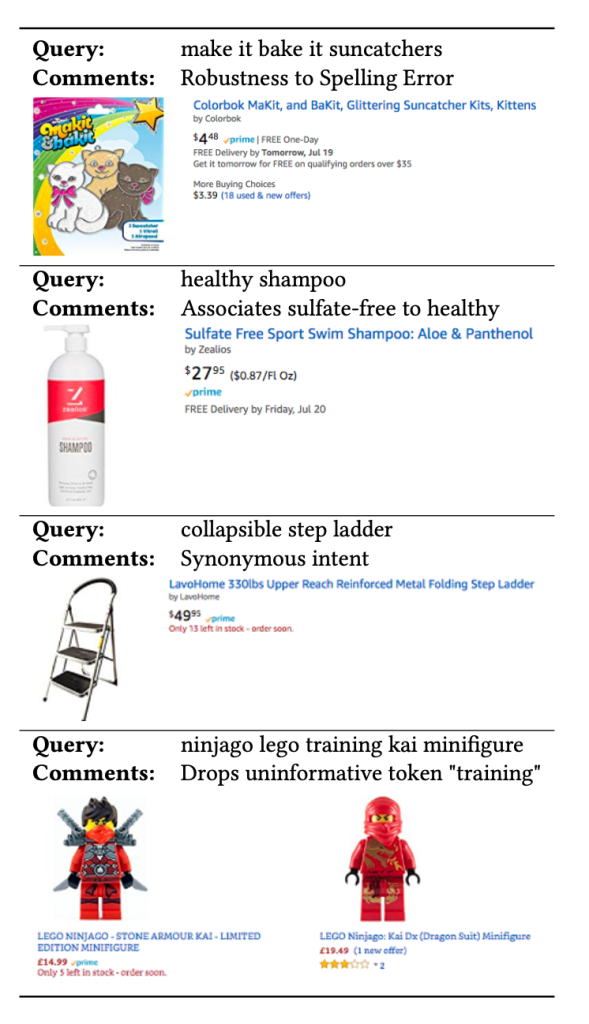
      • Robustness to spelling error
    • OOV adds additional parameters
      • case 1 : 500k unigrams
      • case 2 : 125k unigrams and 375k OOV
      • case 2 performs better
  • Table 4
    • Batch vs layer vs no normalisation
    • query sorted data vs shuffled data
    • Optimum combination was using batch normalisation with shuffled data
    • Query sorted data did not have much effect on layer normalisation but was on batch normalisation
      • Batch estimates for mean and variant would be biased for batch normalisation
  • Table 5

Online evaluations

  • Three categories
    • toys and games, kitchen and pets
  • Conversion rate, revenue and other KPI increased with statistical significance
  • Challenges
    • Precision was decreased
    • To mitigate they added guardrails using some heuristic and ranking models to filter non relevant items
    • Not that recall@100 was metric for matching task and not precision.

Training Acceleration

  • Increasing query product pairs from 200 million to 1.2 billion had improved matching metric by 10 %
  • Data parallel training
    • Idea
      • Split data
      • Same model on multiple GPUs
      • Take the average of gradient in the end
    • Cons for this architecture
      • Limits embedding metric
        • It has to fit on single GPU
      • Data parallel approach has high communication overhead
        • We need to weight till forward pass from each GPU is available
  • Model parallel training
    • Pros in this architecture
      • Simplicity of average pooling
      • Siamese has some parallelism by default
    • How they implemented
      • Embedding metric is split across GPUs, across embedding dimension
        • Hence we need to concat to get final embedding vector for each token
          • Concatenation requires O(2k) communication of floating point numbers
        • Partial token embeddings are averaged at each GPUs
      • Full dataset is sent to all GPUs
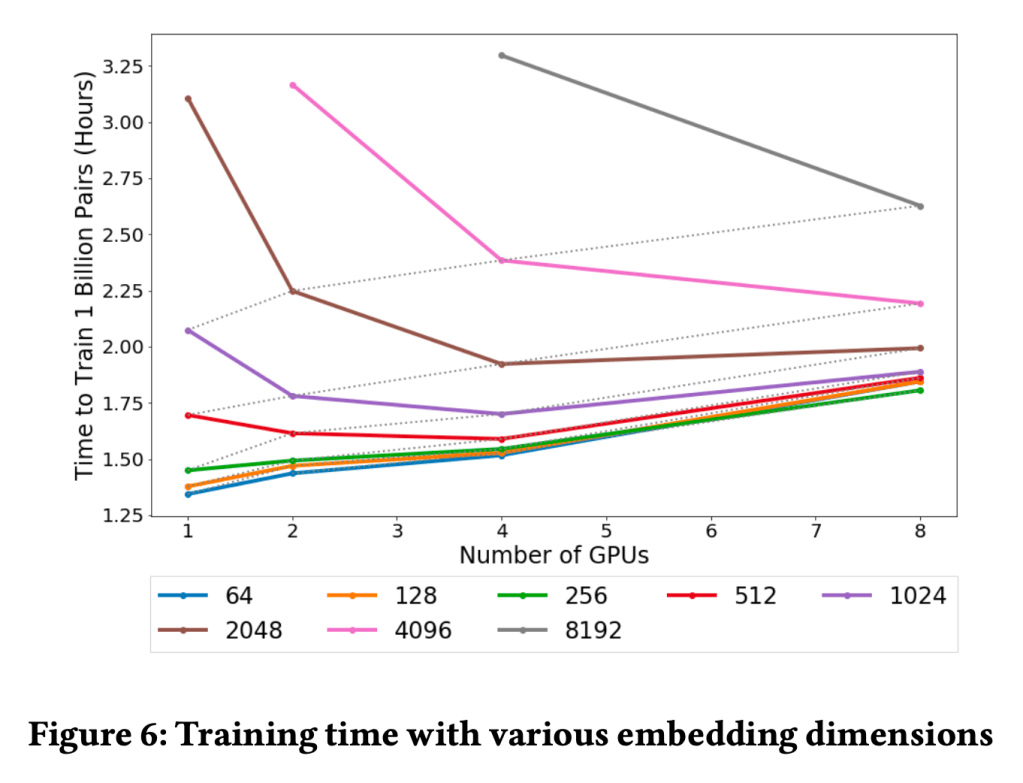
  • In the result section they have told that embedding dimension was 256
  • Explaining above image
    • For low embedding dimension time-to-train increases with number of GPUs but for high embedding dimension time-to-train decreases with number of GPUs
    • Dotted line
      • Following two should have same training time
        • 2048 embedding with 1 GPU
        • 1024 embedding with 2 GPU
      • Doted line is for the ration of embedding_size/GPU
      • With ideal scaling it would be horizontal

Exampels

Exponential, Poisson and Gamma Distribution

All three distribution models different aspect of same process – poisson process.

Poisson Distribution

  • It is used to predict probability of number of events occurring in fixed amount of time
  • Binomial distribution also models similar thing
    • No of heads in n coin flips
    • It has two parameters, n and p. Where p is probability of success.
  • Shortcoming of binomial
    • We want a single number i.e. k events per hour. Binomial has two – n & p
    • More than one event can occur in unit time. 1 like per hour, 1 like per minute.
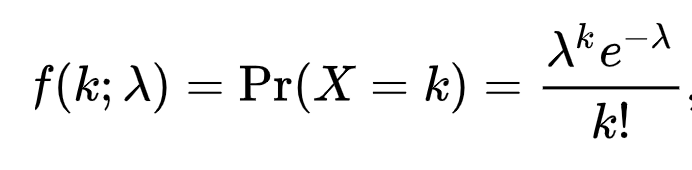
  • Below formula
    • lambda events occur in unit time
    • Below PDF is probability of k events in unique time
  • Properties
    • Popularly it is used to model rare events so we see small values of lambda often. But that is not restriction
    • Distribution is asymmetric. There is no such thing as # of events < 0
    • As lambda increases, it looks like normal distribution.
  • Poisson Model Assumptions
    • Average rate of events per unit time is constant
    • Events are independent

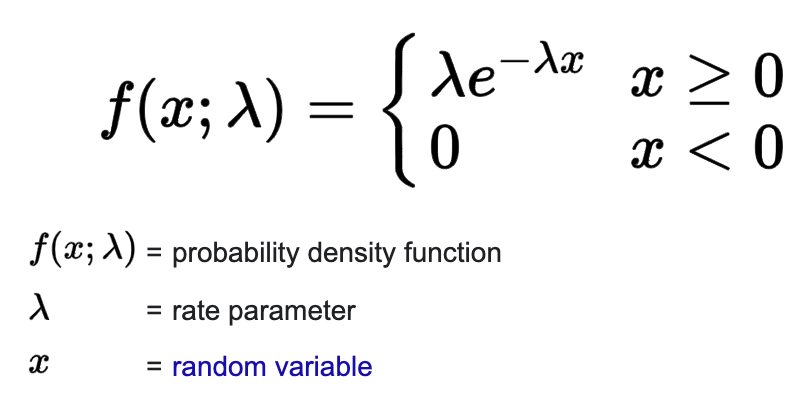
Exponential Distribution

  • Poisson – prob (k events in unit time)
  • Exponential – Prob (Amount of time between events) = Prob(amount of time until first event)
  • lambda – # no of events in unit time
    • rate
    • same as poisson
  • Derivation from Poisson
    • Exponential CDF can be derived from Poisson PDF
    • Differentiating it gives exponential PDF
  • Memoryless property
    • P(T > (a+b) | P(a) ) = P( T > b )
    • When memory is require we use weibull distribution
      • Older the car, more likely break down
  • When memory is not required
    • Probability that next bus arrives in less than 10 minutes
    • Probability that server will run without restart for 10k hours
    • Time for cook to prepare potato chips (probability not at a point, some range always)
  • Geometric distribution is counter part of exponential in discrete space
    • Corresponding poisson counterpart is binomial distribution
    • No of throws required to observe heads
    • It is also memory less
  • It is monotonically decreasing distribution
  • Expected value = mean = 1 / lambda

Gamma Distribution

  • Exponential – wait time till first. event
  • Gamma – wait time till k events
    • Two params – k and lambda
    • Probability of observing k events in time t
  • Applications
    • You are in a queue for medical checkup. There are 7 people in front of you. Avg time to check one person is 5 minute. (rate = lambada = 1/5 and k = 7)
  • Literature uses different symbols for above parameters
    • alpha, beta
    • theta, k
  • K can be real number in gamma distribution
    • To restrict k to be integer there is Erlang distribution
  • Gamma function – Gamma ( k ) = ( k – 1 ) !

Reference

Quantile Function (Inverse CDF)

Introduction

CDF maps input between in [0,1]. That is CDF(x) -> (0,1)

Quantile function takes input in (0,1) and return x.

  • Not all functionals are invertible.
  • Continuous distribution easily satisfies this property
  • For discrete distributions we take innfimum of all values [0]

Application in Sampling

  • Suppose we want to sample from a given distribution
  • We can make a quantile function of it
  • Sample uniformly from [0,1], call it p
  • x = quatile(p)
  • x is the sampled value [1]

Application in point estimation

  • Suppose you want to model CTR (click through rate)
  • CTR lies in (0,1) and can be presented via beta distribution
  • You have clicks and impressions for two ads/items anything
  • We are more confident about CTR when you have more impressions
  • We can construct a beta distribution with mean as point CTR.
    • ctr = beta(clicks, impression-clicks)
    • Recall in thompson sampling we were increasing alpha and beta by 1
  • Now we take 1%, 5%, 10% from quantile function.
    • We would generally have features for historical clicks and impressions.
    • If we have CTR as a feature, we can have this 5% number instead of a point estimate.
  • When we have more impressions ctr_x would be close to mean ctr (point estimate), else it will be less
  • On side node – this way of constructing distribution gets us away from point estimation and can be used in bayesian approaches

Reference

[0] https://stats.stackexchange.com/questions/212813/help-me-understand-the-quantile-inverse-cdf-function

[1] https://stats.stackexchange.com/questions/184325/how-does-the-inverse-transform-method-work/184337#184337

Gradient Boosting

Some people use term bagging and boosting, some use parallel and sequential ensembles. I have written a post on AdaBoost previously. So we are familiar with boosting idea.

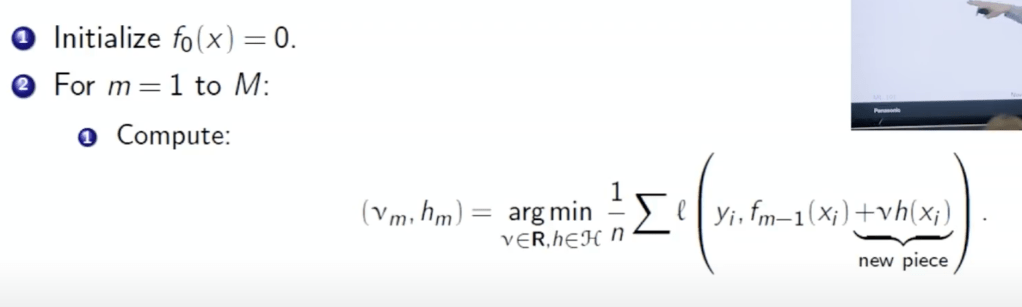
In AdaBoost we had a formula for generating labels (label/sample weight in loss function to be precise) for next iteration. In gradient boosting we fit gradient of loss function with respect to predictions.

Prof Balaraman notes

  • Most of this post contains info from [0]. However Prof. Balaraman offers intuitive perspective in one of his lectures. [3]
  • My handwritten note on that is available at [2]
  • We can write decision tree as equation where regions and value in the region are parameters.
  • Two steps of gradient boosting
    1. Fit gradient of loss function using regression trees (least square loss)
    2. Compute values in region using loss defined for application (ndcg for ranking, log-loss for classifier anything)
  • Whatever is application loss, we fit regression tree using least square
  • Parametric gradient descent can be seen as series of summation starting from initial guess.
  • Related paper [4]

Basis Functions

  • Basis functions
    • If we want to fit non linear curve with simple linear regression, we will create polynomial features
    • It is not limited to regression though
  • Adaptive Basis function
    • Instead of we defining above functions, we learn them
    • This can be framed as optimisation problem and can be solved by gradient descent/newton’s method for some hypothesis space
  • How to include Tree’s in base hypothesis space
    • Something which we can not differentiate
    • Even if we fix parameters to split on output is still not continuous
    • So it is difficult

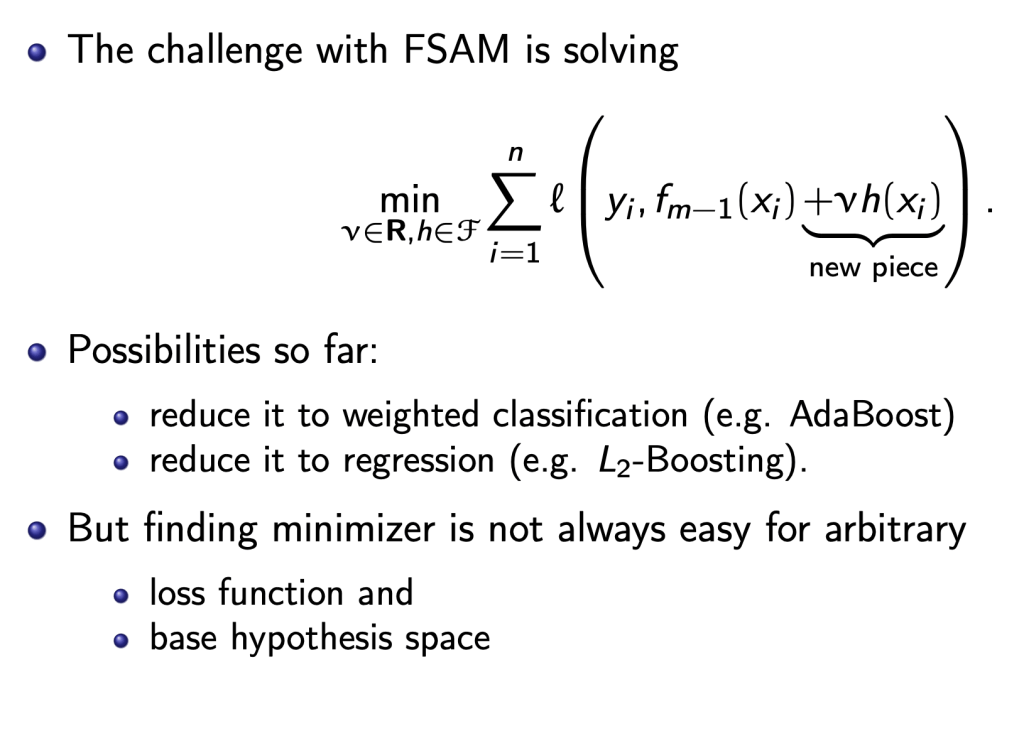
FSAM

  • FSAM
    • Forward Stage-wise Additive Modelling
    • AdaBoost is example of this, another example is L2 boosting
    • We can say weak function is step direction and coefficient is step size
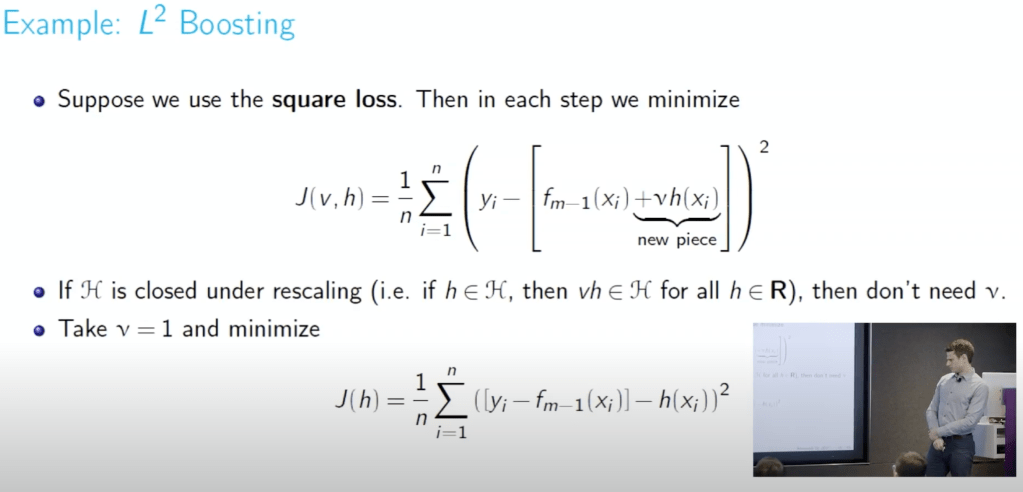
  • L2 Boosting also example of FSAM
    • We are fitting residual
    • To prevent overfitting we can reduce step size
    • If v*h(x) is also in H, we can remove v. (closed under rescaling)
    • h(x) can be decision stump we can keep going as long as residuals exist (It will certainly overfit after few iterations)
  • Adaboost
    • It works for classification problem
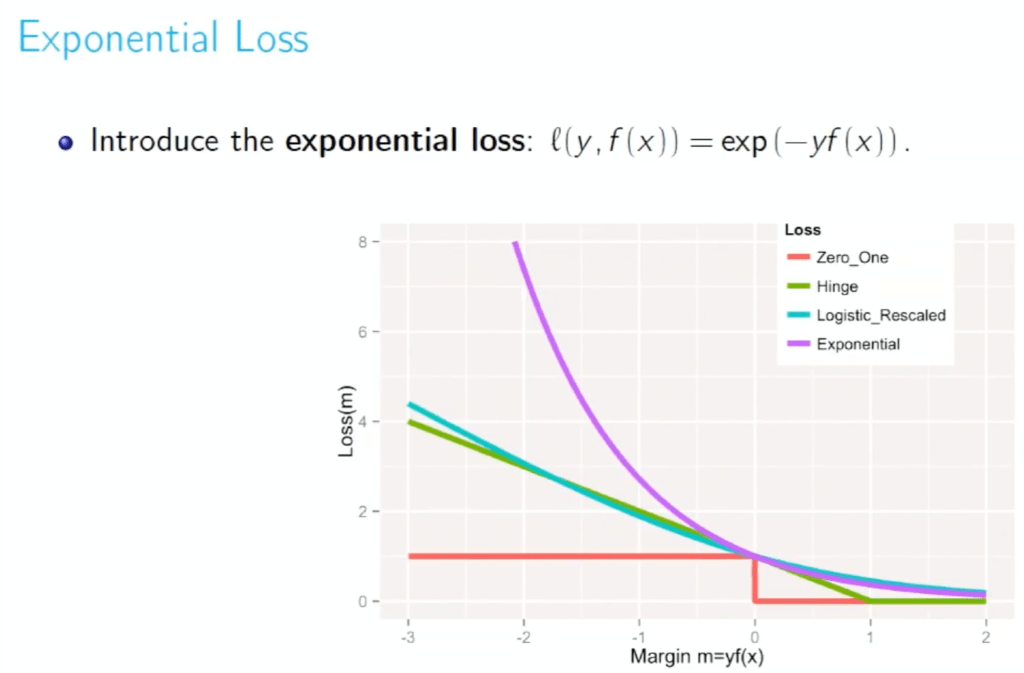
    • When the loss function in FSAM is exponential loss of margin, it reduces adaboost
    • margin = y*f(x)
      • We had encountered that in SVM
  • Disadvantages of AdaBoost
    • Gives too much penalty for negative margin, look at the curve of exponential above
    • Mislabel training data
    • Sometimes there is noise in world
    • Does not work when there is high baye’s error
    • Also it seems AdaBoost formulation is very much tied to classification
      • We probably needs to tweak it to apply it to ranking problem
      • But gradient boosting can be applied to any problem (loss function)
        • Because Tree is alway using L2 loss
Slide from [1]

Functional Gradient Descent

  • Gradient is pseudo residuals
    • For L2 loss it is actually residuals (difference between y and f)
    • Examples where residuals are not just difference between y and f
      • logistic loss
      • ranking using ndcg
  • We fit this gradient(pseudo-residuals) with weak function
    • Regression Tree is most common
    • We find closest approximation to gradient step in base hypothesis space (which is functional space)
    • Here we minimize square loss (regression problem)
  • Earlier tree used to be just stumps
    • That is num of leaf node = 2
    • Now a days xgboost/light gbm takes upto 8/16 leaf nodes as well
  • Note that while calculating gradient the hypothesis function is not involved anywhere
  • How do we calculate gradient over function space
    • In close form expression it might look complicated
    • From numerical computation perspective we need gradient at just one point (of dimension training data size)
    • This is just like taking gradient of weights in linear regression
      • Here size of gradient vector would be number of training examples
    • In most of the method we take gradient of parameters, here we are taking gradient of predictions
  • What should be step size
    • Line search
    • Regularisation parameter (similar to what we use for any gradient based optimisation)
      • This is more common

Reference

[0] https://www.youtube.com/watch?v=fz1H03ZKvLM

[1] https://davidrosenberg.github.io/mlcourse/Archive/2016/Lectures/8b.gradient-boosting.pdf

[2] https://github.com/arcarchit/datastories/blob/master/notes/gradient_boost_iitm.pdf

[3] https://www.youtube.com/watch?v=FJ-MA0EfJ9k

[4] https://statweb.stanford.edu/~jhf/ftp/trebst.pdf

Central limit theorem

What does CLT says ?

  • Sum of random samples forms normal distribution
    • This samples may not come from normal distribution
  • Sum forming random distribution implies that mean would also form normal distribution

Straight facts

  • Central limit theorem helps getting confidence interval for parameters
  • It works for all distributions when n > 30
  • For normal distribution it works even if n < 30
  • Why do we need to have distribution
    • To make variance estimation stable
    • We want to have just one unknown that is mean
    • We need to test normality of samples before applying t-test

Slide from MIT course : https://ocw.mit.edu/courses/mathematics/18-650-statistics-for-applications-fall-2016/

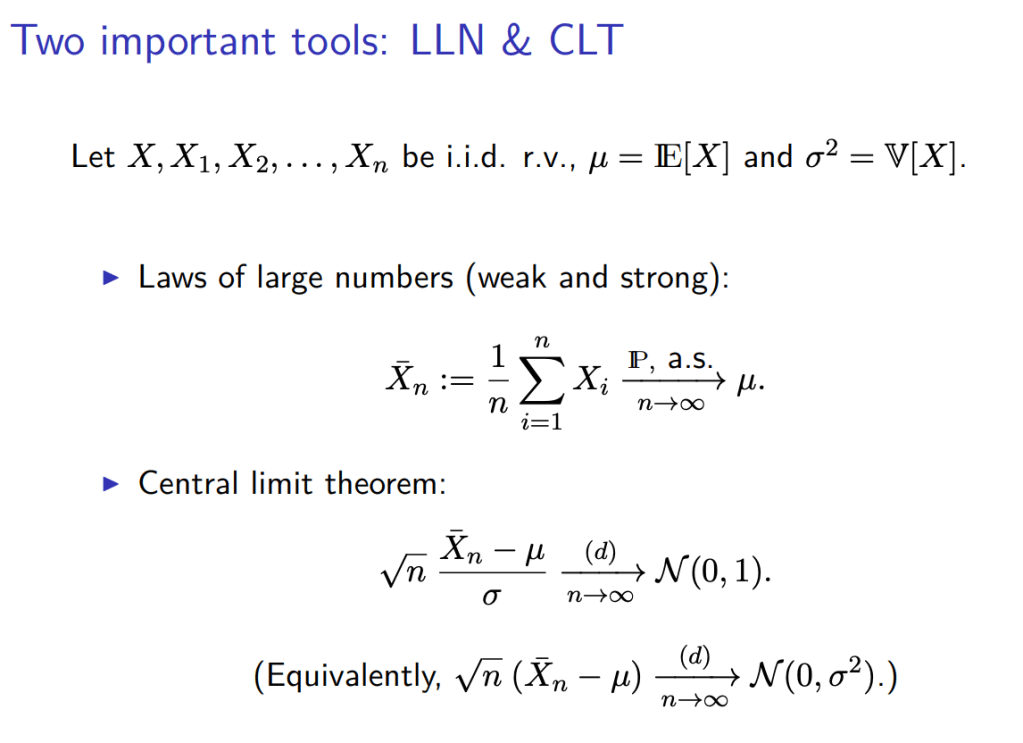
sigma / (sqrt(n)) is standard error of mean. We are saying this distribution reaches to standard normal distribution.

Law of Larger Number

  • As a sample size grows, its mean gets closer to the average of the whole population. This is due to the sample being more representative of the population

Example:

  • During significance testing we calculate left hand side. For examples testing fairness of coin that number comes out to be 3.54. Now for standard normal 3*sigma = 3*1 = 3 is 99 % of area. We are further away than it. So we can reject null hypothesis. [1]
  • Thing to understand is that distribution of Bernoulli parameter(p) is normal.
  • We are not saying how far observed mean is from 0.5 in Bernoulli distribution. If we were doing that we would not have used sqrt(n).
    • Also more importantly Bernoulli can take only two values 0 and 1. From that perspective as well it does not make sense.
    • See the equation in the slide below in central limit theorem. It is a normal distribution N(0,1).

Refereces

[0] : Slide from MIT course : https://ocw.mit.edu/courses/mathematics/18-650-statistics-for-applications-fall-2016/

[1] : https://ocw.mit.edu/courses/18-650-statistics-for-applications-fall-2016/resources/mit18_650f16_parametric_ht/

Types of Statistical Studies

We study to learn something new. The word “study” in statistics implies conducting an experiment and analyzing data to learn something new, investigate something, or draw confident conclusions.

Studies are prevalent in medical fields, where people study various types of drugs on different demographics, geographies, and health conditions. This blog essentially contains my notes from the Coursera course: “Clinical Research” (https://www.coursera.org/learn/clinical-research/home/welcome).

Types of Studies:

  1. Observational Studies:
    • Case Series Study: Observes and describes subjects without requiring a research hypothesis. Numbers derived from such studies help remove inherent biases. These studies often serve as initial steps for complex studies.
    • Case Control Studies: Compare two or more groups based on the presence or absence of a disease. These studies look at historical data to identify variables that differ between the groups. Confounding, such as smoking in a study on alcohol and heart attacks, needs to be controlled for.
      • Many times when you are presenting analysis experienced seniors would ask what was the value of this feature in both cases ?
    • Cross-Sectional Studies: Conducted in the form of surveys, gathering data at a specific time. For example, a survey sent to optometrists and ophthalmologists to understand their dietary advice to patients. These studies aim to examine current practices and identify areas for improvement. (Reference: https://www.ncbi.nlm.nih.gov/pmc/articles/PMC3695797/)
      • Drawbacks
        • Responsive bias
          • Suppose you are asking questions related to HIV. Positive patients are less likely to answer than negative ones.
          • In govt survey people in cities are more likely to answer than villages
        • Almost impossible to infer causality
          • Since this takes place at a particular place in time, we can not determine whether disease outcome followed exposure or exposure followed disease.
    • Cohort Studies: Identify a group of subjects (cohort) and follow them either backward in history (retrospective cohort) or forward in the future (prospective cohort). Computerized data collection has made retrospective cohorts possible. These studies are observational and do not involve controlling variables.
  2. Experimental Studies (Interventional):
    • In these studies, interventions are implemented to reduce bias inherent in observational studies. There is a control group that receives no intervention (sham/placebo).
    • Some Key Terms:
      • Randomization: Every member of the population should have an equal opportunity to be part of the study, and participants should have an equal chance of being assigned to any group.
      • Blinding: Participants are unaware of their assigned groups. If researchers are also unaware of the groups, it is called a double-blind study. Achieving double-blindness is challenging in surgical operations.

Reservoir sampling

Where it is used

  • Suppose you have a streaming data and you want to randomly sample from it. You don’t know how many items will be coming in.
  • You have large set of items to sample from and you want to do it in single pass

How it is done

  • Suppose you want to sample 1000 items.[1]
  • You take first 1000 items and put it into reservoir
  • Next you will take 1001th item with probability 1000/1001
    • You take a random number and if it is less than 1000/1001, you add this item to reservoir
    • Remember the CDF trick
    • You take the 1002th item with probability of 1000/1002
  • When you add this item, you randomly remove any other item from reservoir

Alternative

  • Pick items from stream, generate a random no and put it in priority queue
  • This is how order by rand() in sql works [1]

References

[1] https://gregable.com/2007/10/reservoir-sampling.html

[2] https://www.youtube.com/watch?v=Ybra0uGEkpM (proof)

log-linear and log-log regression

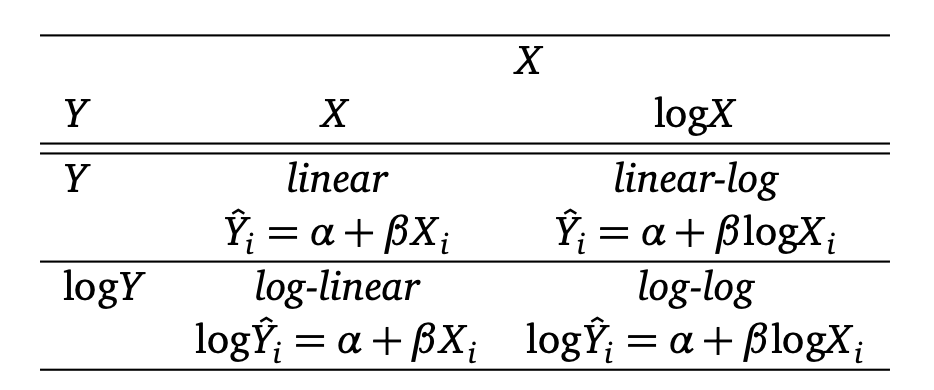
In linear regression taking log is popular way to make relationship linear. We can take log of either response or predictor or both. This gives us four classes [0]

log_llog

Interpretations of β

  • Linear Model
    • the coefficient β gives us directly the change in Y for a one-unit change in X
  • Linear Log Model
    • β is the expected change in Y when X is multiplied by e (natural log)
  • Log Linear Model
    • Each 1-unit increase in X multiplies the expected value of Y by e β
  • Log Log Model
    • multiplying X by e will multiply expected value of Y by e βˆ

I have coded notebook to see the curves for all four at [1]. 

A note on Normalisation

  • Suppose you need to normalise a data to bring it between 0 and 1. This will be feed into some linear function (say ranking function without supervised response y). If you data is exponentially distributed instead of dividing by max, you can try log(sample)/log(max).  This is like feature transformation by taking log and then normalising it.
    • That’s about normalising variable which seems to have exponential distribution
  • Also when you check correlation with response variable and you see plots like [1] you know which transformation to take.
References :

[0] https://kenbenoit.net/assets/courses/ME104/logmodels2.pdf
[1] https://github.com/arcarchit/datastories/blob/master/notebooks/log_linear_models.ipynb